
Corebridge Financial has been treading water for the past six months, recording a small return of 2.5% while holding steady at $33.40. The stock also fell short of the S&P 500’s 15.9% gain during that period.
Is now the time to buy Corebridge Financial, or should you be careful about including it in your portfolio? Get the full stock story straight from our expert analysts, it’s free.
Why Is Corebridge Financial Not Exciting?
We're swiping left on Corebridge Financial for now. Here are three reasons there are better opportunities than CRBG and a stock we'd rather own.
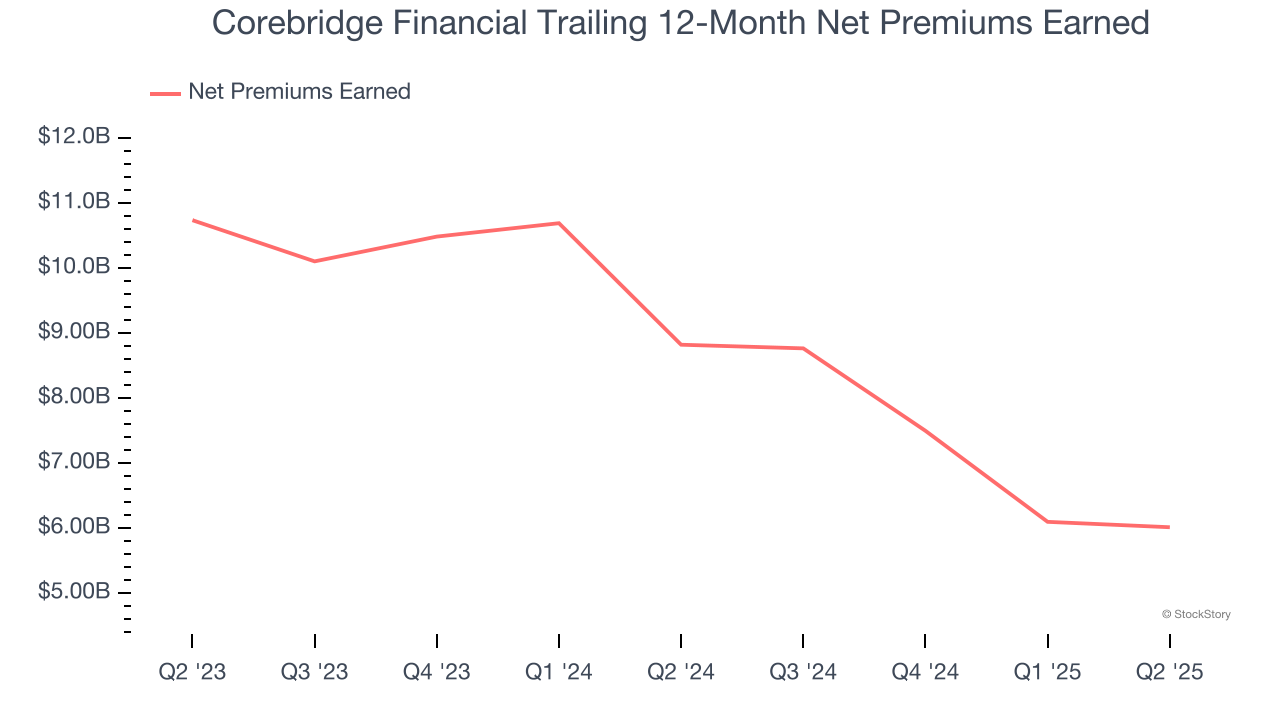
1. Declining Net Premiums Earned Reflect Weakness
When insurers sell policies, they protect themselves from extremely large losses or an outsized accumulation of losses with reinsurance (insurance for insurance companies). Net premiums earned are:
- Gross premiums - what’s ceded to reinsurers as a risk mitigation and transfer strategy
Corebridge Financial’s net premiums earned has declined by 2.9% annually over the last four years, much worse than the broader insurance industry.
The debt-to-equity ratio is a widely used measure to assess a company's balance sheet health. A higher ratio means that a business aggressively financed its growth with debt. This can result in higher earnings (if the borrowed funds are invested profitably) but also increases risk.
If debt levels are too high, there could be difficulties in meeting obligations, especially during economic downturns or periods of rising interest rates if the debt has variable-rate payments.
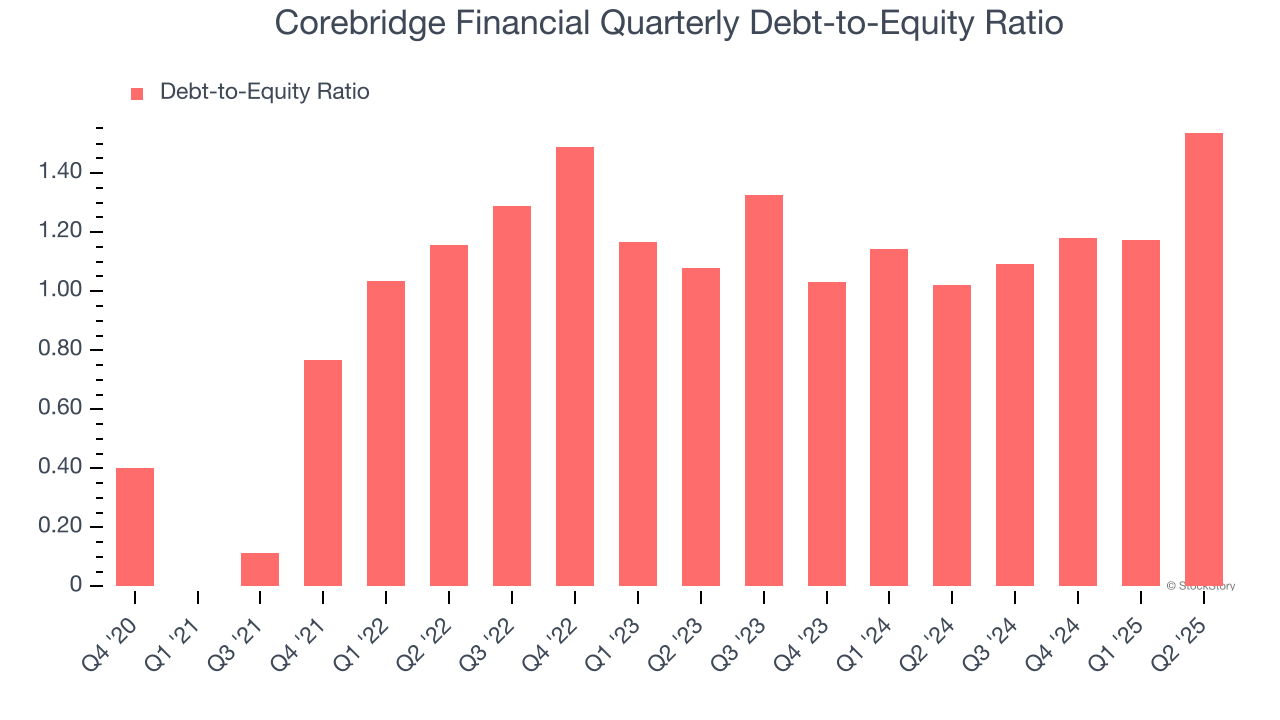
Corebridge Financial currently has $18.91 billion of debt and $12.3 billion of shareholder's equity on its balance sheet, and over the past four quarters, has averaged a debt-to-equity ratio of 1.2×. We think this is dangerous - for an insurance business, anything above 1.0× raises red flags.
Final Judgment
Corebridge Financial isn’t a terrible business, but it doesn’t pass our quality test. With its shares underperforming the market lately, the stock trades at 1.4× forward P/B (or $33.40 per share). This valuation is reasonable, but the company’s shakier fundamentals present too much downside risk. We're pretty confident there are more exciting stocks to buy at the moment. Let us point you toward the most entrenched endpoint security platform on the market.
High-Quality Stocks for All Market Conditions
Donald Trump’s April 2025 "Liberation Day" tariffs sent markets into a tailspin, but stocks have since rebounded strongly, proving that knee-jerk reactions often create the best buying opportunities.
The smart money is already positioning for the next leg up. Don’t miss out on the recovery - check out our Top 9 Market-Beating Stocks. This is a curated list of our High Quality stocks that have generated a market-beating return of 183% over the last five years (as of March 31st 2025).
Stocks that made our list in 2020 include now familiar names such as Nvidia (+1,545% between March 2020 and March 2025) as well as under-the-radar businesses like the once-small-cap company Exlservice (+354% five-year return). Find your next big winner with StockStory today.
StockStory is growing and hiring equity analyst and marketing roles. Are you a 0 to 1 builder passionate about the markets and AI? See the open roles here.