
Benchmark has been treading water for the past six months, recording a small loss of 3.7% while holding steady at $39.19. The stock also fell short of the S&P 500’s 15.9% gain during that period.
Is now the time to buy Benchmark, or should you be careful about including it in your portfolio? Dive into our full research report to see our analyst team’s opinion, it’s free.
Why Is Benchmark Not Exciting?
We don't have much confidence in Benchmark. Here are three reasons why BHE doesn't excite us and a stock we'd rather own.
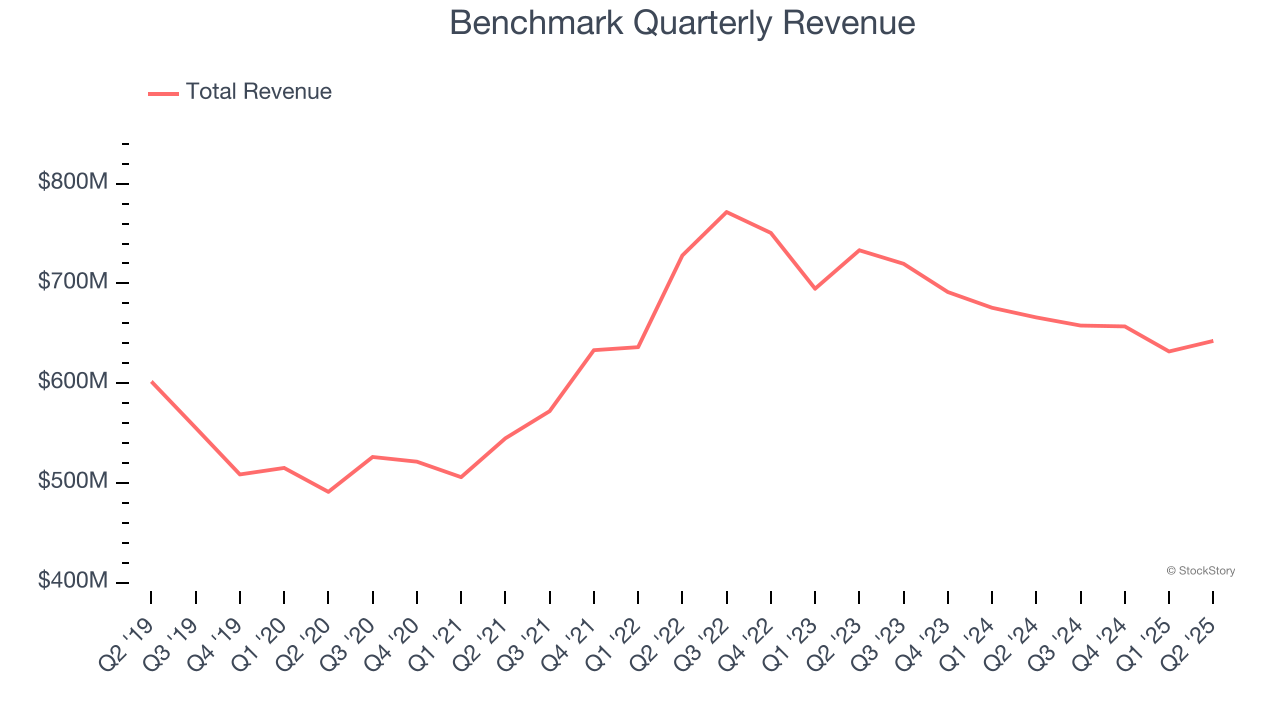
1. Long-Term Revenue Growth Disappoints
Examining a company’s long-term performance can provide clues about its quality. Any business can put up a good quarter or two, but the best consistently grow over the long haul. Regrettably, Benchmark’s sales grew at a mediocre 4.6% compounded annual growth rate over the last five years. This fell short of our benchmark for the business services sector.
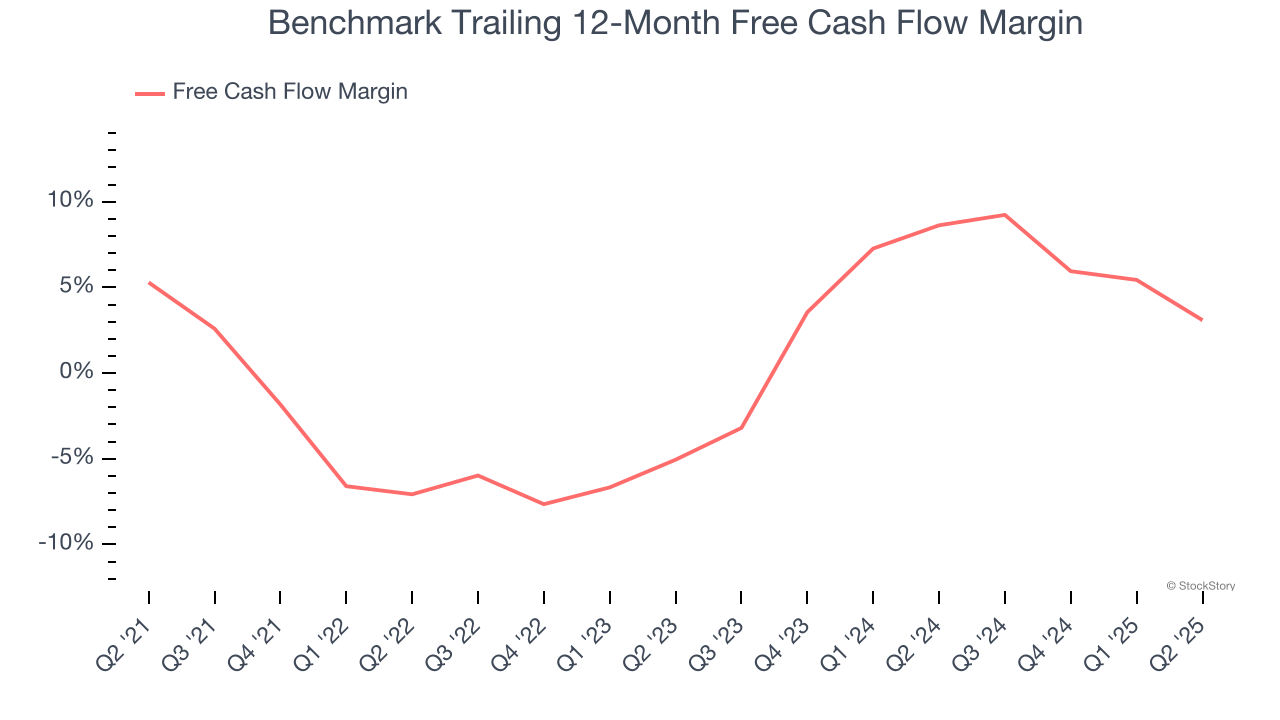
2. Breakeven Free Cash Flow Limits Reinvestment Potential
Free cash flow isn't a prominently featured metric in company financials and earnings releases, but we think it's telling because it accounts for all operating and capital expenses, making it tough to manipulate. Cash is king.
Benchmark broke even from a free cash flow perspective over the last five years, giving the company limited opportunities to return capital to shareholders.
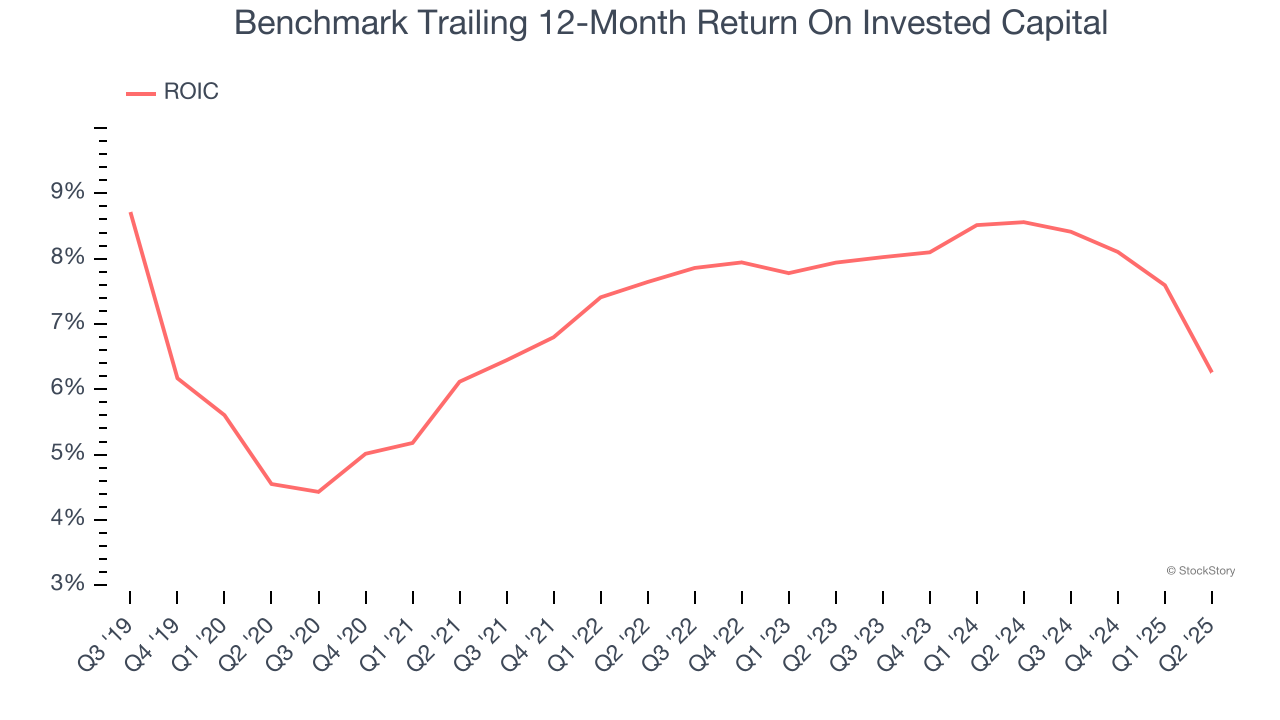
3. Previous Growth Initiatives Haven’t Impressed
Growth gives us insight into a company’s long-term potential, but how capital-efficient was that growth? Enter ROIC, a metric showing how much operating profit a company generates relative to the money it has raised (debt and equity).
Benchmark historically did a mediocre job investing in profitable growth initiatives. Its five-year average ROIC was 7.3%, somewhat low compared to the best business services companies that consistently pump out 25%+.
Final Judgment
Benchmark isn’t a terrible business, but it isn’t one of our picks. With its shares trailing the market in recent months, the stock trades at 15.8× forward P/E (or $39.19 per share). Investors with a higher risk tolerance might like the company, but we don’t really see a big opportunity at the moment. We're fairly confident there are better stocks to buy right now. We’d recommend looking at one of Charlie Munger’s all-time favorite businesses.
Stocks We Would Buy Instead of Benchmark
Donald Trump’s April 2025 "Liberation Day" tariffs sent markets into a tailspin, but stocks have since rebounded strongly, proving that knee-jerk reactions often create the best buying opportunities.
The smart money is already positioning for the next leg up. Don’t miss out on the recovery - check out our Top 5 Strong Momentum Stocks for this week. This is a curated list of our High Quality stocks that have generated a market-beating return of 183% over the last five years (as of March 31st 2025).
Stocks that made our list in 2020 include now familiar names such as Nvidia (+1,545% between March 2020 and March 2025) as well as under-the-radar businesses like the once-small-cap company Comfort Systems (+782% five-year return). Find your next big winner with StockStory today.
StockStory is growing and hiring equity analyst and marketing roles. Are you a 0 to 1 builder passionate about the markets and AI? See the open roles here.