
Over the past six months, OneMain has been a great trade, beating the S&P 500 by 8.8%. Its stock price has climbed to $60.58, representing a healthy 24.7% increase. This was partly due to its solid quarterly results, and the run-up might have investors contemplating their next move.
Is now the time to buy OneMain, or should you be careful about including it in your portfolio? See what our analysts have to say in our full research report, it’s free.
Why Do We Think OneMain Will Underperform?
Despite the momentum, we don't have much confidence in OneMain. Here are three reasons we avoid OMF and a stock we'd rather own.
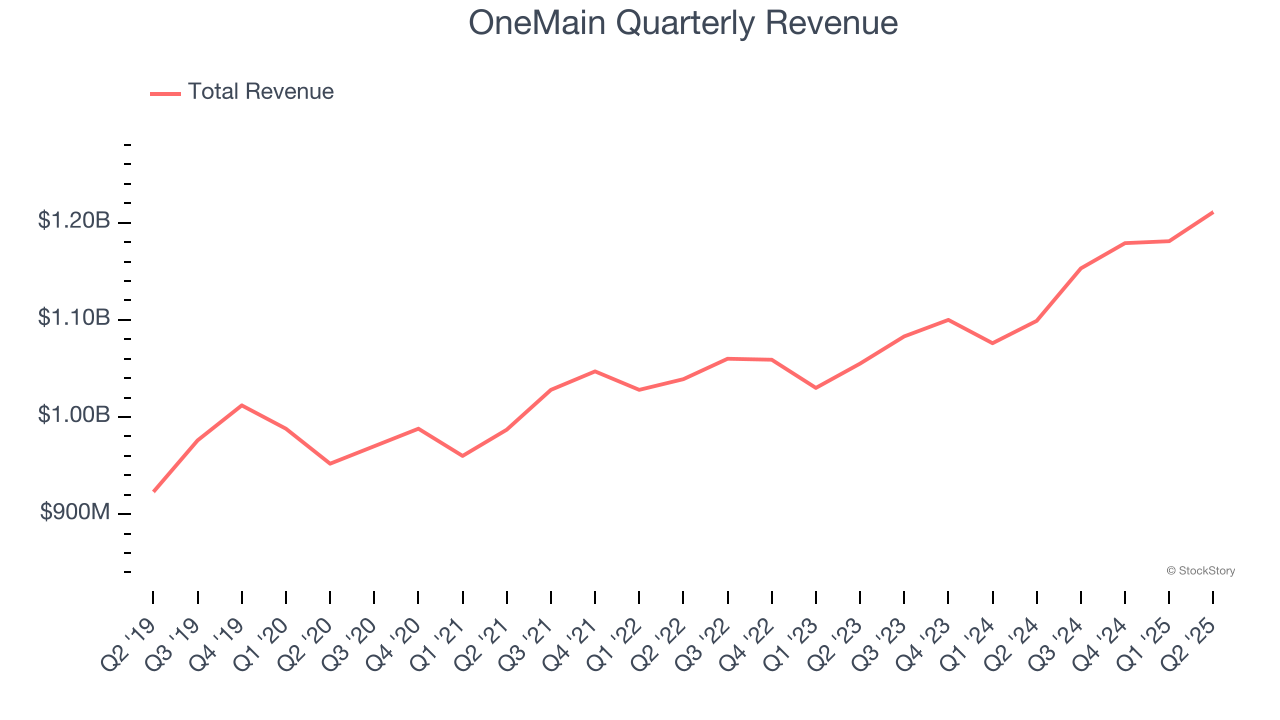
1. Long-Term Revenue Growth Disappoints
Reviewing a company’s long-term sales performance reveals insights into its quality. Any business can have short-term success, but a top-tier one grows for years.
Over the last five years, OneMain grew its revenue at a sluggish 3.8% compounded annual growth rate. This was below our standard for the financials sector.
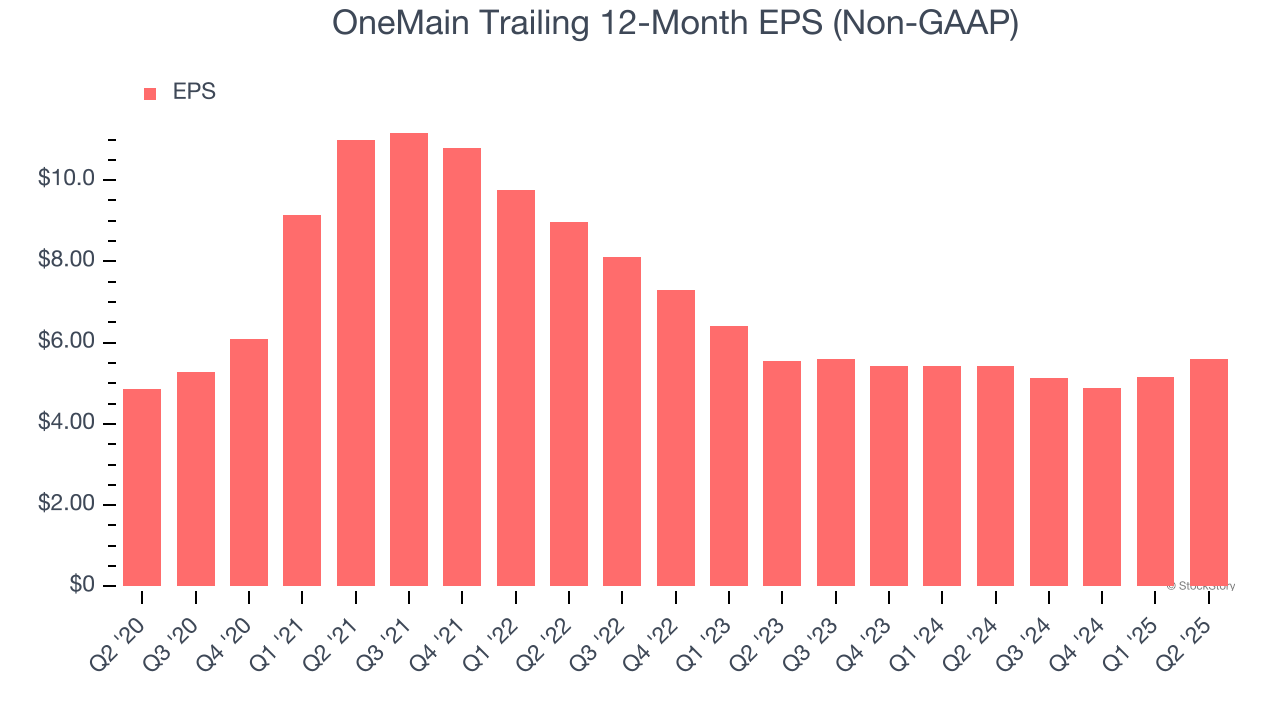
2. EPS Barely Growing
Analyzing the long-term change in earnings per share (EPS) shows whether a company's incremental sales were profitable – for example, revenue could be inflated through excessive spending on advertising and promotions.
OneMain’s weak 2.8% annual EPS growth over the last five years aligns with its revenue performance. On the bright side, this tells us its incremental sales were profitable.
The debt-to-equity ratio is a widely used measure to assess a company's balance sheet health. A higher ratio means that a business aggressively financed its growth with debt. This can result in higher earnings (if the borrowed funds are invested profitably) but also increases risk.
If debt levels are too high, there could be difficulties in meeting obligations, especially during economic downturns or periods of rising interest rates if the debt has variable-rate payments.
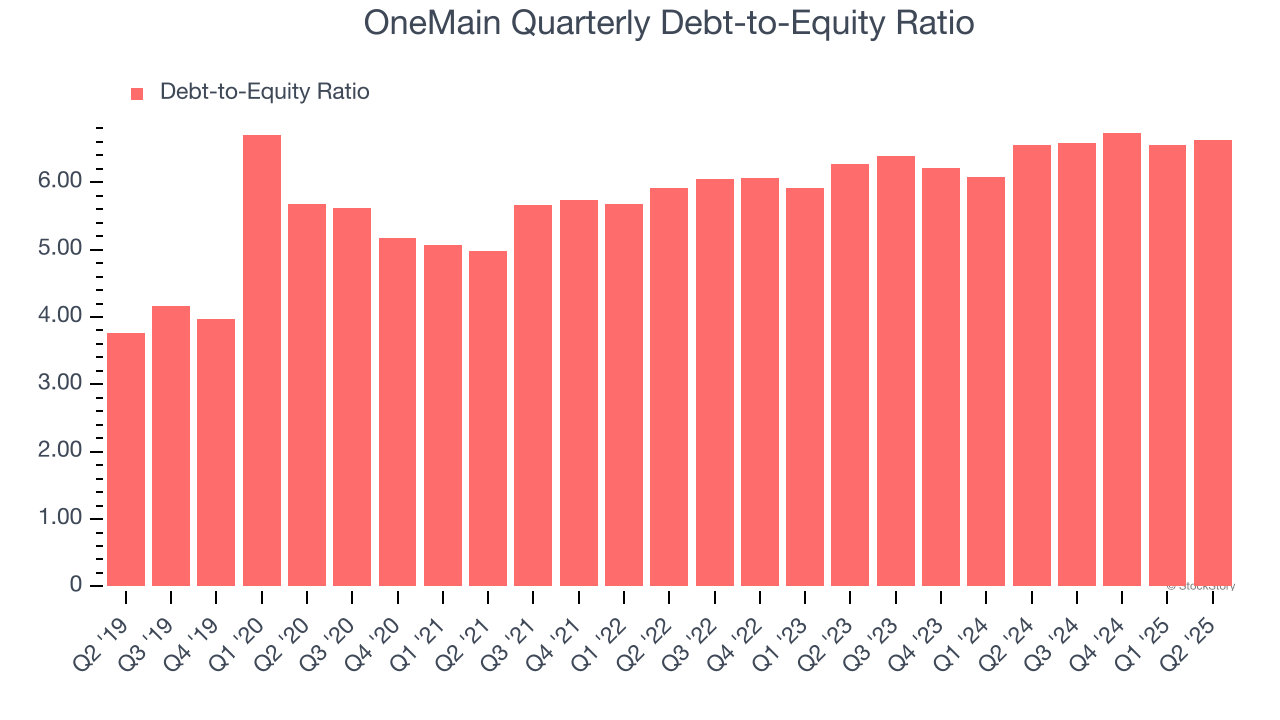
OneMain currently has $22.05 billion of debt and $3.33 billion of shareholder's equity on its balance sheet, and over the past four quarters, has averaged a debt-to-equity ratio of 6.6×. We think this is dangerous - for a financials business, anything above 3.5× raises red flags.
Final Judgment
We cheer for all companies supporting the economy, but in the case of OneMain, we’ll be cheering from the sidelines. With its shares topping the market in recent months, the stock trades at 8.6× forward P/E (or $60.58 per share). While this valuation is optically cheap, the potential downside is huge given its shaky fundamentals. There are better investments elsewhere. We’d recommend looking at one of our all-time favorite software stocks.
Stocks We Like More Than OneMain
When Trump unveiled his aggressive tariff plan in April 2025, markets tanked as investors feared a full-blown trade war. But those who panicked and sold missed the subsequent rebound that’s already erased most losses.
Don’t let fear keep you from great opportunities and take a look at Top 5 Strong Momentum Stocks for this week. This is a curated list of our High Quality stocks that have generated a market-beating return of 183% over the last five years (as of March 31st 2025).
Stocks that made our list in 2020 include now familiar names such as Nvidia (+1,545% between March 2020 and March 2025) as well as under-the-radar businesses like the once-small-cap company Exlservice (+354% five-year return). Find your next big winner with StockStory today.
StockStory is growing and hiring equity analyst and marketing roles. Are you a 0 to 1 builder passionate about the markets and AI? See the open roles here.