Earnings results often indicate what direction a company will take in the months ahead. With Q2 behind us, let’s have a look at Lovesac (NASDAQ: LOVE) and its peers.
A healthy housing market is good for furniture demand as more consumers are buying, renting, moving, and renovating. On the other hand, periods of economic weakness or high interest rates discourage home sales and can squelch demand. In addition, home furnishing companies must contend with shifting consumer preferences such as the growing propensity to buy goods online, including big things like mattresses and sofas that were once thought to be immune from e-commerce competition.
The 6 home furnishings stocks we track reported a satisfactory Q2. As a group, revenues were in line with analysts’ consensus estimates while next quarter’s revenue guidance was 1% above.
In light of this news, share prices of the companies have held steady as they are up 4.3% on average since the latest earnings results.
Lovesac (NASDAQ: LOVE)
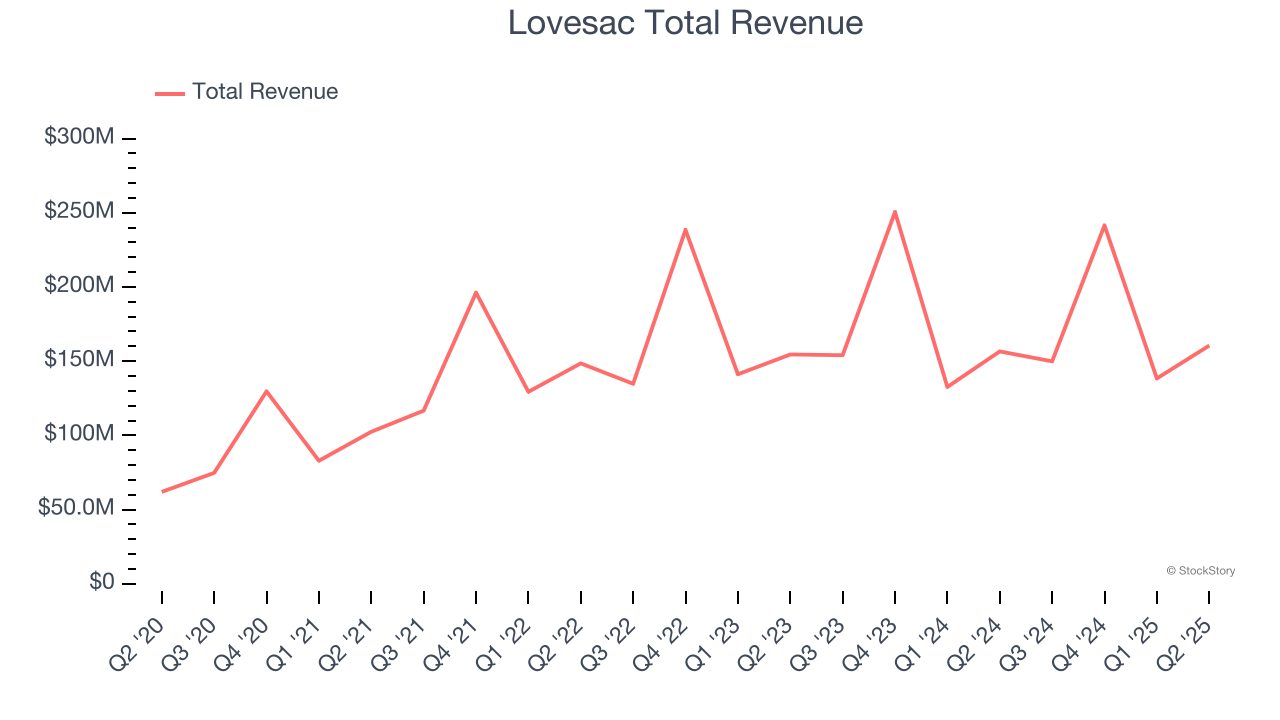
Known for its oversized, premium beanbags, Lovesac (NASDAQ: LOVE) is a specialty furniture brand selling modular furniture.
Lovesac reported revenues of $160.5 million, up 2.5% year on year. This print was in line with analysts’ expectations, and overall, it was a strong quarter for the company with a beat of analysts’ EPS and EBITDA estimates.
Shawn Nelson, Chief Executive Officer, stated, “We're pleased to have delivered another quarter of market share gains underpinned by our secular growth initiatives across Designed for Life product platforms and efficient customer acquisition engines.”
Lovesac pulled off the highest full-year guidance raise of the whole group. Investor expectations, however, were likely higher than Wall Street’s published projections, leaving some wishing for even better results (analysts’ consensus estimates are those published by big banks and advisory firms, not the investors who make buy and sell decisions). The stock is down 12.5% since reporting and currently trades at $18.17.
Is now the time to buy Lovesac? Access our full analysis of the earnings results here, it’s free.
Best Q2: Purple (NASDAQ: PRPL)
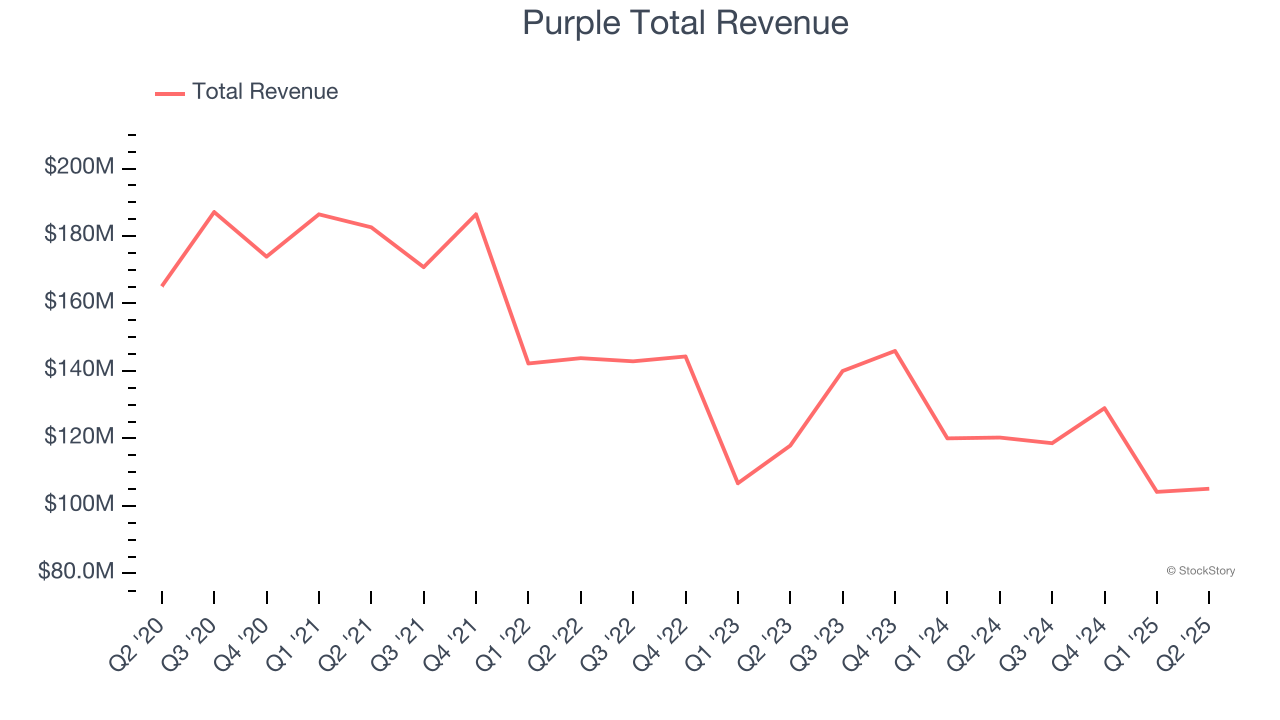
Founded by two brothers, Purple (NASDAQ: PRPL) creates sleep and home comfort products such as mattresses, pillows, and bedding accessories.
Purple reported revenues of $105.1 million, down 12.6% year on year, in line with analysts’ expectations. The business had an exceptional quarter with an impressive beat of analysts’ adjusted operating income estimates.
The market seems happy with the results as the stock is up 19.8% since reporting. It currently trades at $1.02.
Is now the time to buy Purple? Access our full analysis of the earnings results here, it’s free.
Weakest Q2: La-Z-Boy (NYSE: LZB)
The prized possession of every mancave, La-Z-Boy (NYSE: LZB) is a furniture company specializing in recliners, sofas, and seats.
La-Z-Boy reported revenues of $492.2 million, flat year on year, in line with analysts’ expectations. It was a slower quarter as it posted a significant miss of analysts’ EPS and adjusted operating income estimates.
As expected, the stock is down 13.9% since the results and currently trades at $33.69.
Read our full analysis of La-Z-Boy’s results here.
Leggett & Platt (NYSE: LEG)
Founded in 1883, Leggett & Platt (NYSE: LEG) is a diversified manufacturer of products and components for various industries.
Leggett & Platt reported revenues of $1.06 billion, down 6.3% year on year. This result was in line with analysts’ expectations. Taking a step back, it was a mixed quarter as it also recorded a decent beat of analysts’ adjusted operating income estimates.
Leggett & Platt had the weakest full-year guidance update among its peers. The stock is flat since reporting and currently trades at $9.59.
Read our full, actionable report on Leggett & Platt here, it’s free.
Mohawk Industries (NYSE: MHK)
Established in 1878, Mohawk Industries (NYSE: MHK) is a leading producer of floor-covering products for both residential and commercial applications.
Mohawk Industries reported revenues of $2.80 billion, flat year on year. This number topped analysts’ expectations by 2.2%. Aside from that, it was a satisfactory quarter as it also produced a solid beat of analysts’ organic revenue estimates but EPS guidance for next quarter missing analysts’ expectations.
Mohawk Industries scored the biggest analyst estimates beat among its peers. The stock is up 17.3% since reporting and currently trades at $136.06.
Read our full, actionable report on Mohawk Industries here, it’s free.
Market Update
The Fed’s interest rate hikes throughout 2022 and 2023 have successfully cooled post-pandemic inflation, bringing it closer to the 2% target. Inflationary pressures have eased without tipping the economy into a recession, suggesting a soft landing. This stability, paired with recent rate cuts (0.5% in September 2024 and 0.25% in November 2024), fueled a strong year for the stock market in 2024. The markets surged further after Donald Trump’s presidential victory in November, with major indices reaching record highs in the days following the election. Still, questions remain about the direction of economic policy, as potential tariffs and corporate tax changes add uncertainty for 2025.
Want to invest in winners with rock-solid fundamentals? Check out our Top 5 Quality Compounder Stocks and add them to your watchlist. These companies are poised for growth regardless of the political or macroeconomic climate.
StockStory is growing and hiring equity analyst and marketing roles. Are you a 0 to 1 builder passionate about the markets and AI? See the open roles here.