Since March 2025, Timken has been in a holding pattern, posting a small return of 3.9% while floating around $78.14. The stock also fell short of the S&P 500’s 16.5% gain during that period.
Is now the time to buy Timken, or should you be careful about including it in your portfolio? See what our analysts have to say in our full research report, it’s free.
Why Do We Think Timken Will Underperform?
We're sitting this one out for now. Here are three reasons there are better opportunities than TKR and a stock we'd rather own.
1. Core Business Falling Behind as Demand Declines
In addition to reported revenue, organic revenue is a useful data point for analyzing Engineered Components and Systems companies. This metric gives visibility into Timken’s core business because it excludes one-time events such as mergers, acquisitions, and divestitures along with foreign currency fluctuations - non-fundamental factors that can manipulate the income statement.
Over the last two years, Timken’s organic revenue averaged 4.9% year-on-year declines. This performance was underwhelming and implies it may need to improve its products, pricing, or go-to-market strategy. It also suggests Timken might have to lean into acquisitions to grow, which isn’t ideal because M&A can be expensive and risky (integrations often disrupt focus). 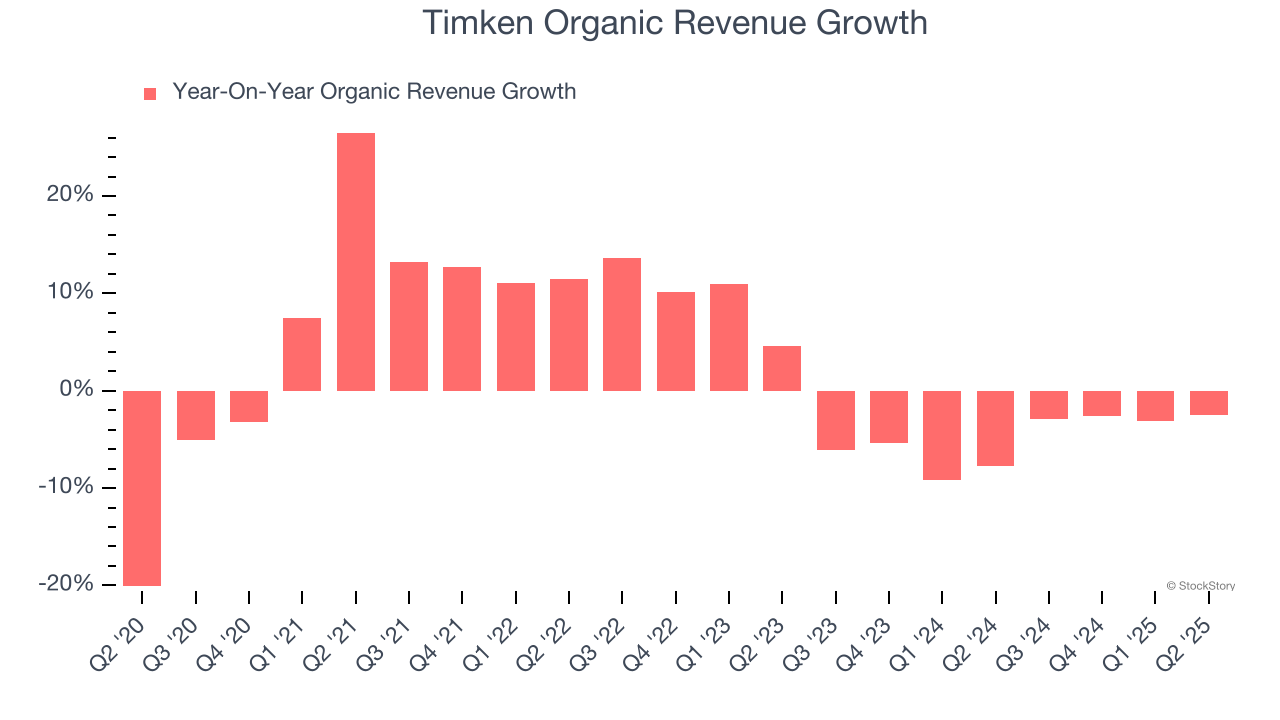
2. Projected Revenue Growth Shows Limited Upside
Forecasted revenues by Wall Street analysts signal a company’s potential. Predictions may not always be accurate, but accelerating growth typically boosts valuation multiples and stock prices while slowing growth does the opposite.
Over the next 12 months, sell-side analysts expect Timken’s revenue to stall. While this projection indicates its newer products and services will spur better top-line performance, it is still below average for the sector.
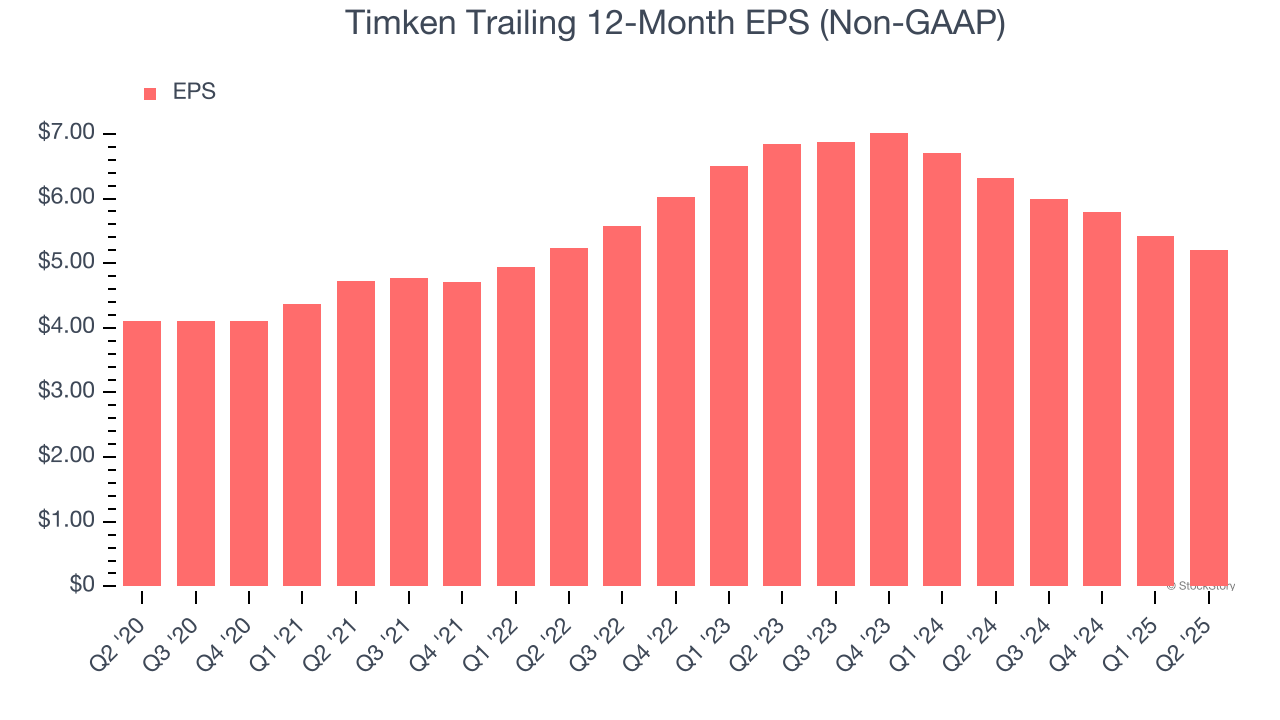
3. EPS Barely Growing
We track the long-term change in earnings per share (EPS) because it highlights whether a company’s growth is profitable.
Timken’s unimpressive 4.9% annual EPS growth over the last five years aligns with its revenue performance. This tells us it maintained its per-share profitability as it expanded.
Final Judgment
Timken doesn’t pass our quality test. With its shares trailing the market in recent months, the stock trades at 13× forward P/E (or $78.14 per share). While this valuation is fair, the upside isn’t great compared to the potential downside. There are better investments elsewhere. Let us point you toward an all-weather company that owns household favorite Taco Bell.
High-Quality Stocks for All Market Conditions
Donald Trump’s April 2025 "Liberation Day" tariffs sent markets into a tailspin, but stocks have since rebounded strongly, proving that knee-jerk reactions often create the best buying opportunities.
The smart money is already positioning for the next leg up. Don’t miss out on the recovery - check out our Top 5 Strong Momentum Stocks for this week. This is a curated list of our High Quality stocks that have generated a market-beating return of 183% over the last five years (as of March 31st 2025).
Stocks that made our list in 2020 include now familiar names such as Nvidia (+1,545% between March 2020 and March 2025) as well as under-the-radar businesses like the once-micro-cap company Tecnoglass (+1,754% five-year return). Find your next big winner with StockStory today.
StockStory is growing and hiring equity analyst and marketing roles. Are you a 0 to 1 builder passionate about the markets and AI? See the open roles here.