
Regal Rexnord trades at $141.07 per share and has stayed right on track with the overall market, gaining 19.1% over the last six months. At the same time, the S&P 500 has returned 16.5%.
Is now the time to buy Regal Rexnord, or should you be careful about including it in your portfolio? See what our analysts have to say in our full research report, it’s free.
Why Is Regal Rexnord Not Exciting?
We're swiping left on Regal Rexnord for now. Here are three reasons we avoid RRX and a stock we'd rather own.
1. Core Business Falling Behind as Demand Declines
In addition to reported revenue, organic revenue is a useful data point for analyzing Engineered Components and Systems companies. This metric gives visibility into Regal Rexnord’s core business because it excludes one-time events such as mergers, acquisitions, and divestitures along with foreign currency fluctuations - non-fundamental factors that can manipulate the income statement.
Over the last two years, Regal Rexnord’s organic revenue averaged 5% year-on-year declines. This performance was underwhelming and implies it may need to improve its products, pricing, or go-to-market strategy. It also suggests Regal Rexnord might have to lean into acquisitions to grow, which isn’t ideal because M&A can be expensive and risky (integrations often disrupt focus). 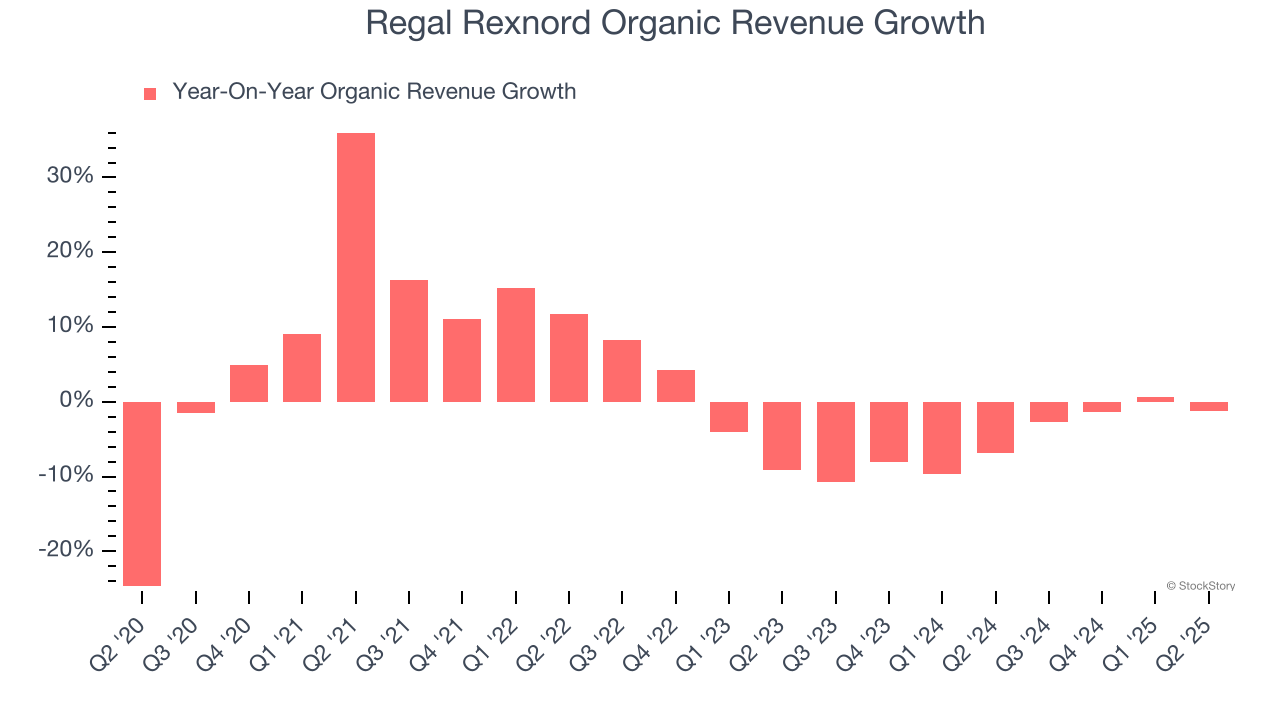
2. EPS Took a Dip Over the Last Two Years
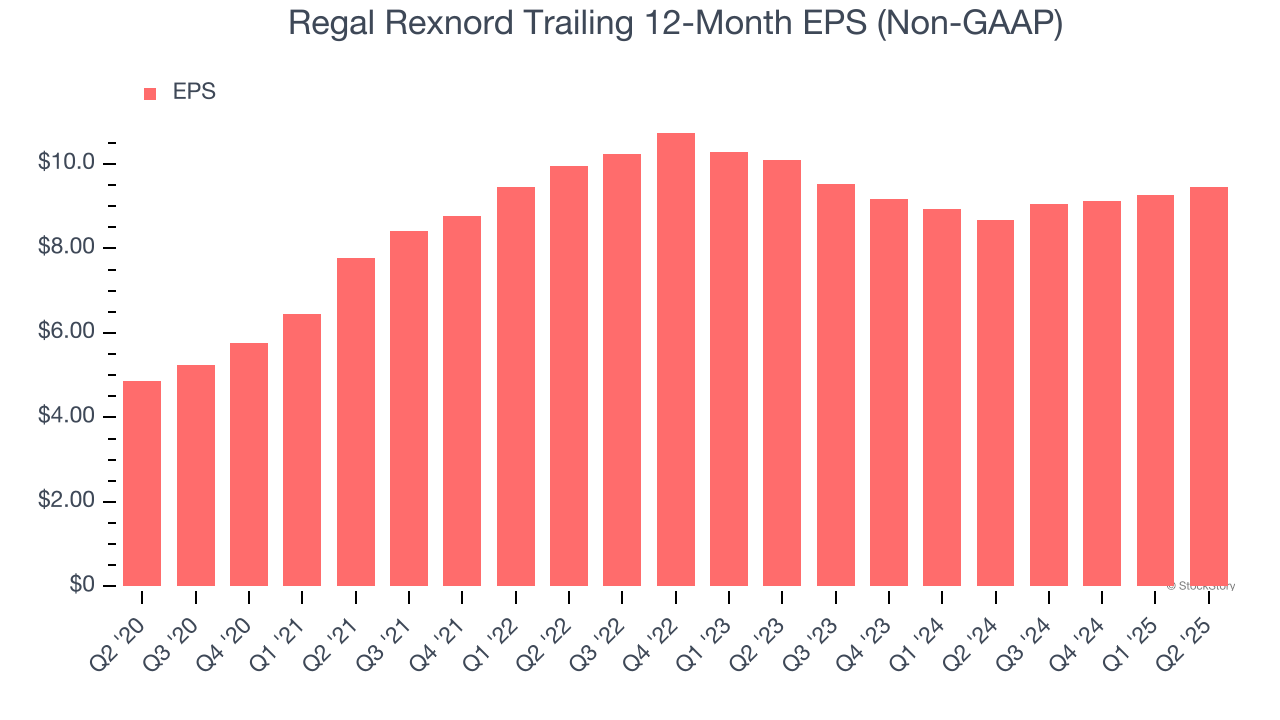
Although long-term earnings trends give us the big picture, we like to analyze EPS over a shorter period to see if we are missing a change in the business.
Sadly for Regal Rexnord, its EPS declined by 3.1% annually over the last two years while its revenue grew by 2.6%. This tells us the company became less profitable on a per-share basis as it expanded.
3. Previous Growth Initiatives Haven’t Impressed
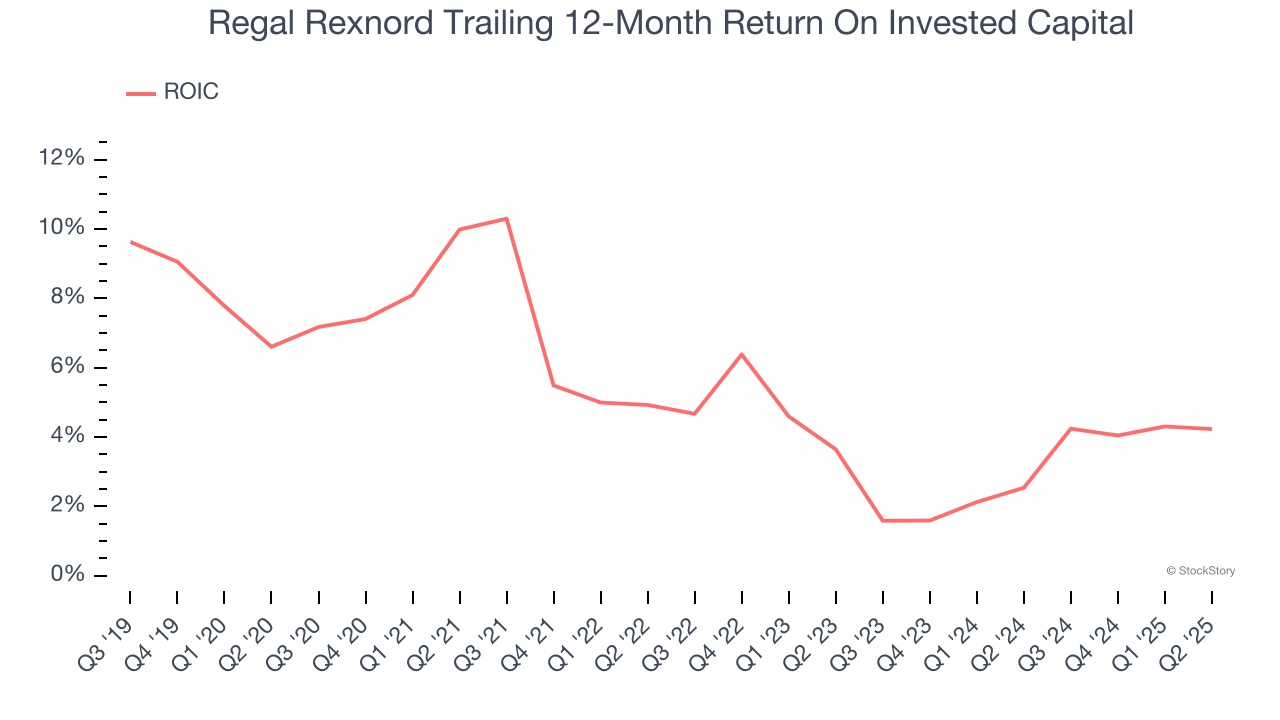
Growth gives us insight into a company’s long-term potential, but how capital-efficient was that growth? Enter ROIC, a metric showing how much operating profit a company generates relative to the money it has raised (debt and equity).
Regal Rexnord historically did a mediocre job investing in profitable growth initiatives. Its five-year average ROIC was 5.1%, somewhat low compared to the best industrials companies that consistently pump out 20%+.
Final Judgment
Regal Rexnord isn’t a terrible business, but it isn’t one of our picks. That said, the stock currently trades at 13.1× forward P/E (or $141.07 per share). This valuation is reasonable, but the company’s shakier fundamentals present too much downside risk. We're fairly confident there are better investments elsewhere. We’d recommend looking at a top digital advertising platform riding the creator economy.
Stocks We Would Buy Instead of Regal Rexnord
Trump’s April 2025 tariff bombshell triggered a massive market selloff, but stocks have since staged an impressive recovery, leaving those who panic sold on the sidelines.
Take advantage of the rebound by checking out our Top 9 Market-Beating Stocks. This is a curated list of our High Quality stocks that have generated a market-beating return of 183% over the last five years (as of March 31st 2025).
Stocks that made our list in 2020 include now familiar names such as Nvidia (+1,545% between March 2020 and March 2025) as well as under-the-radar businesses like the once-small-cap company Comfort Systems (+782% five-year return). Find your next big winner with StockStory today.
StockStory is growing and hiring equity analyst and marketing roles. Are you a 0 to 1 builder passionate about the markets and AI? See the open roles here.