While the S&P 500 is up 16.4% since March 2025, Monro (currently trading at $18.15 per share) has lagged behind, posting a return of 8%. This might have investors contemplating their next move.
Is there a buying opportunity in Monro, or does it present a risk to your portfolio? Check out our in-depth research report to see what our analysts have to say, it’s free.
Why Do We Think Monro Will Underperform?
We're swiping left on Monro for now. Here are three reasons you should be careful with MNRO and a stock we'd rather own.
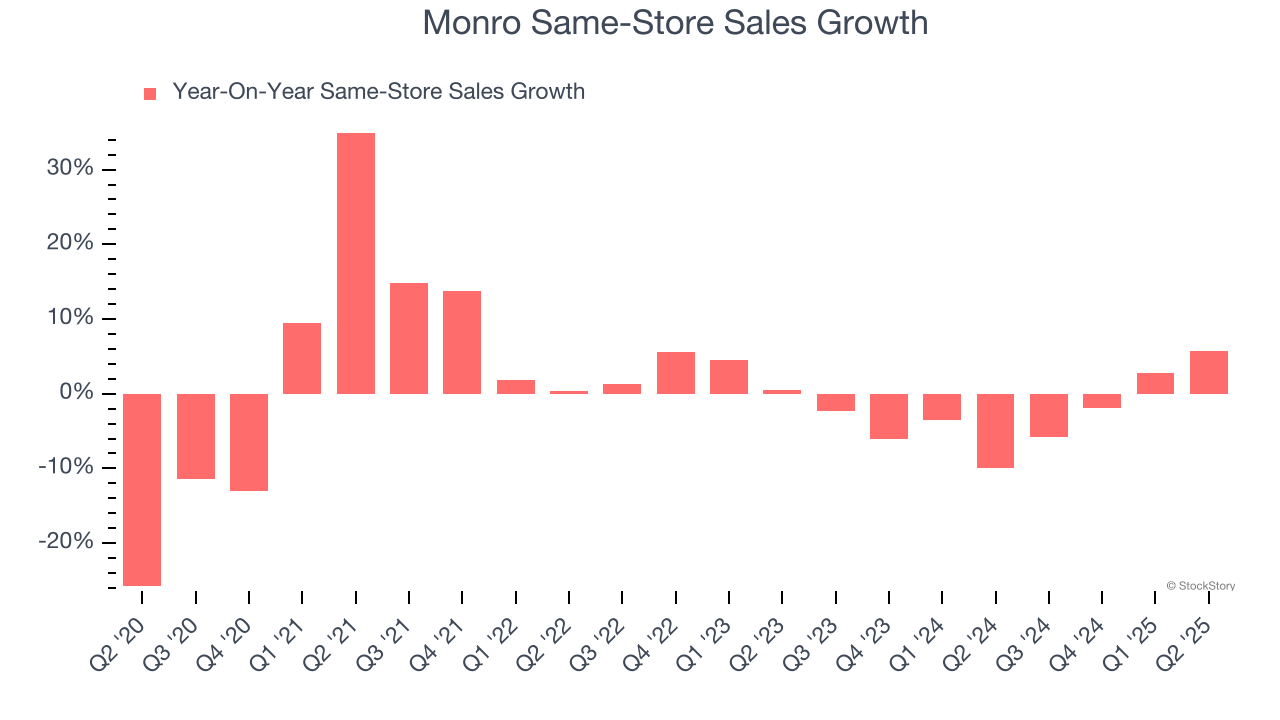
1. Shrinking Same-Store Sales Indicate Waning Demand
Same-store sales is a key performance indicator used to measure organic growth at brick-and-mortar shops for at least a year.
Monro’s demand has been shrinking over the last two years as its same-store sales have averaged 2.6% annual declines.
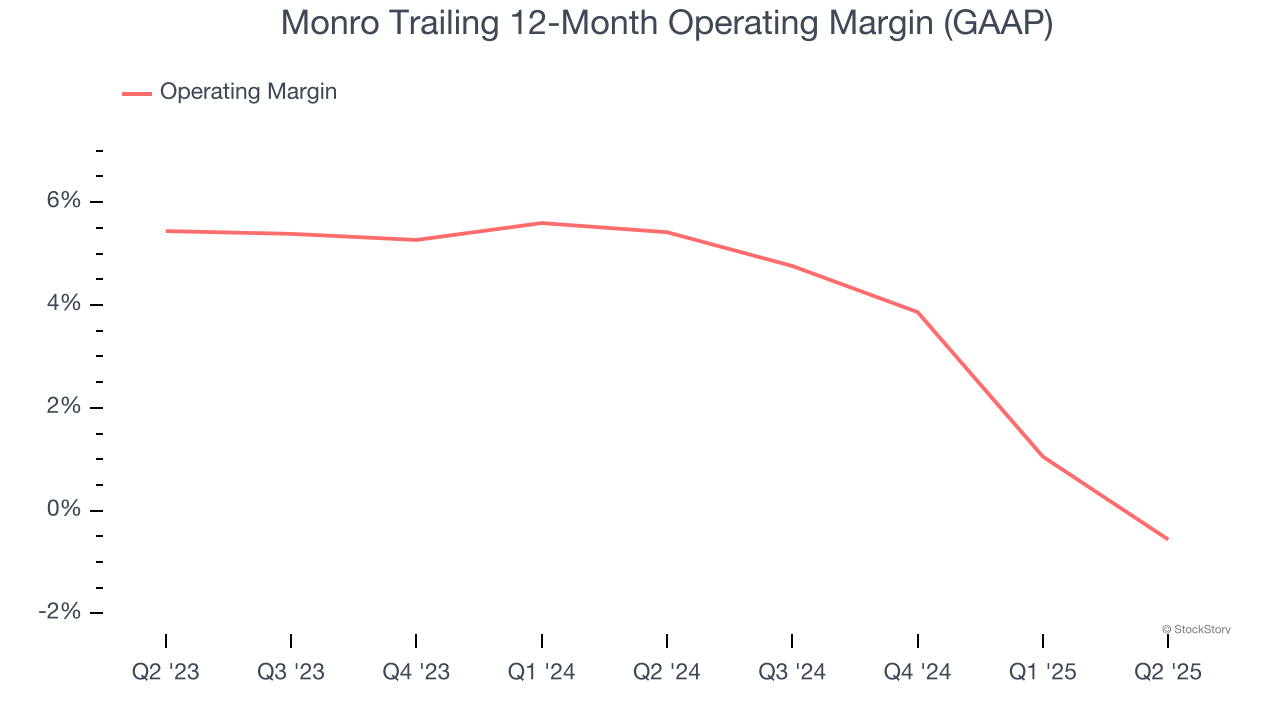
2. Shrinking Operating Margin
Operating margin is an important measure of profitability as it shows the portion of revenue left after accounting for all core expenses – everything from the cost of goods sold to advertising and wages. It’s also useful for comparing profitability across companies with different levels of debt and tax rates because it excludes interest and taxes.
Analyzing the trend in its profitability, Monro’s operating margin decreased by 6 percentage points over the last year. Monro’s performance was poor no matter how you look at it - it shows that costs were rising and it couldn’t pass them onto its customers. Its operating margin for the trailing 12 months was breakeven.
3. Previous Growth Initiatives Haven’t Impressed
Growth gives us insight into a company’s long-term potential, but how capital-efficient was that growth? A company’s ROIC explains this by showing how much operating profit it makes compared to the money it has raised (debt and equity).
Monro historically did a mediocre job investing in profitable growth initiatives. Its five-year average ROIC was 5%, lower than the typical cost of capital (how much it costs to raise money) for consumer retail companies.
Final Judgment
We see the value of companies helping consumers, but in the case of Monro, we’re out. With its shares trailing the market in recent months, the stock trades at 25.4× forward P/E (or $18.15 per share). At this valuation, there’s a lot of good news priced in - we think other companies feature superior fundamentals at the moment. We’d recommend looking at an all-weather company that owns household favorite Taco Bell.
Stocks We Like More Than Monro
Trump’s April 2025 tariff bombshell triggered a massive market selloff, but stocks have since staged an impressive recovery, leaving those who panic sold on the sidelines.
Take advantage of the rebound by checking out our Top 6 Stocks for this week. This is a curated list of our High Quality stocks that have generated a market-beating return of 183% over the last five years (as of March 31st 2025).
Stocks that made our list in 2020 include now familiar names such as Nvidia (+1,545% between March 2020 and March 2025) as well as under-the-radar businesses like the once-small-cap company Comfort Systems (+782% five-year return). Find your next big winner with StockStory today.
StockStory is growing and hiring equity analyst and marketing roles. Are you a 0 to 1 builder passionate about the markets and AI? See the open roles here.