Over the past six months, Bright Horizons’s stock price fell to $110.42. Shareholders have lost 14.5% of their capital, which is disappointing considering the S&P 500 has climbed by 16.4%. This may have investors wondering how to approach the situation.
Is there a buying opportunity in Bright Horizons, or does it present a risk to your portfolio? Get the full breakdown from our expert analysts, it’s free.
Why Do We Think Bright Horizons Will Underperform?
Even with the cheaper entry price, we're cautious about Bright Horizons. Here are three reasons why BFAM doesn't excite us and a stock we'd rather own.
1. Slow Organic Growth Suggests Waning Demand In Core Business
Investors interested in Education Services companies should track organic revenue in addition to reported revenue. This metric gives visibility into Bright Horizons’s core business because it excludes one-time events such as mergers, acquisitions, and divestitures along with foreign currency fluctuations - non-fundamental factors that can manipulate the income statement.
Over the last two years, Bright Horizons’s organic revenue averaged 11.5% year-on-year growth. This performance was underwhelming and suggests it may need to improve its products, pricing, or go-to-market strategy, which can add an extra layer of complexity to its operations. 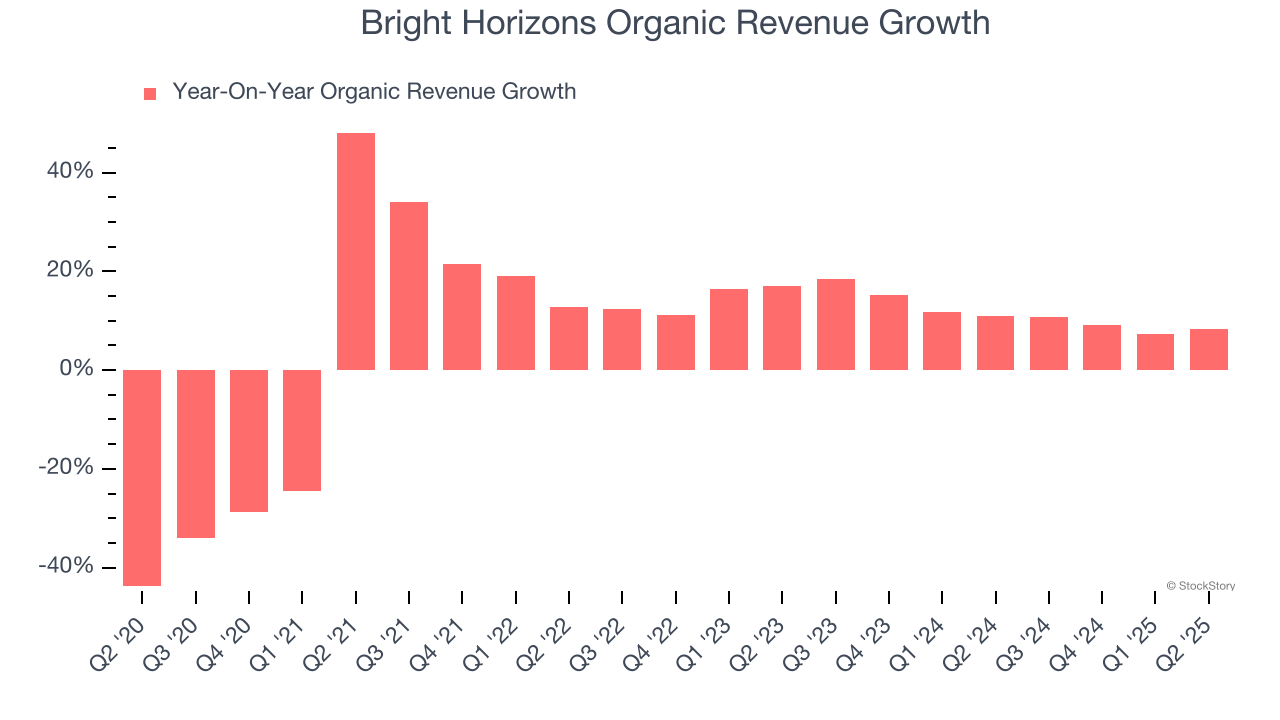
2. Projected Revenue Growth Is Slim
Forecasted revenues by Wall Street analysts signal a company’s potential. Predictions may not always be accurate, but accelerating growth typically boosts valuation multiples and stock prices while slowing growth does the opposite.
Over the next 12 months, sell-side analysts expect Bright Horizons’s revenue to rise by 7.6%, a deceleration versus its 8.8% annualized growth for the past five years. This projection doesn't excite us and implies its products and services will face some demand challenges.
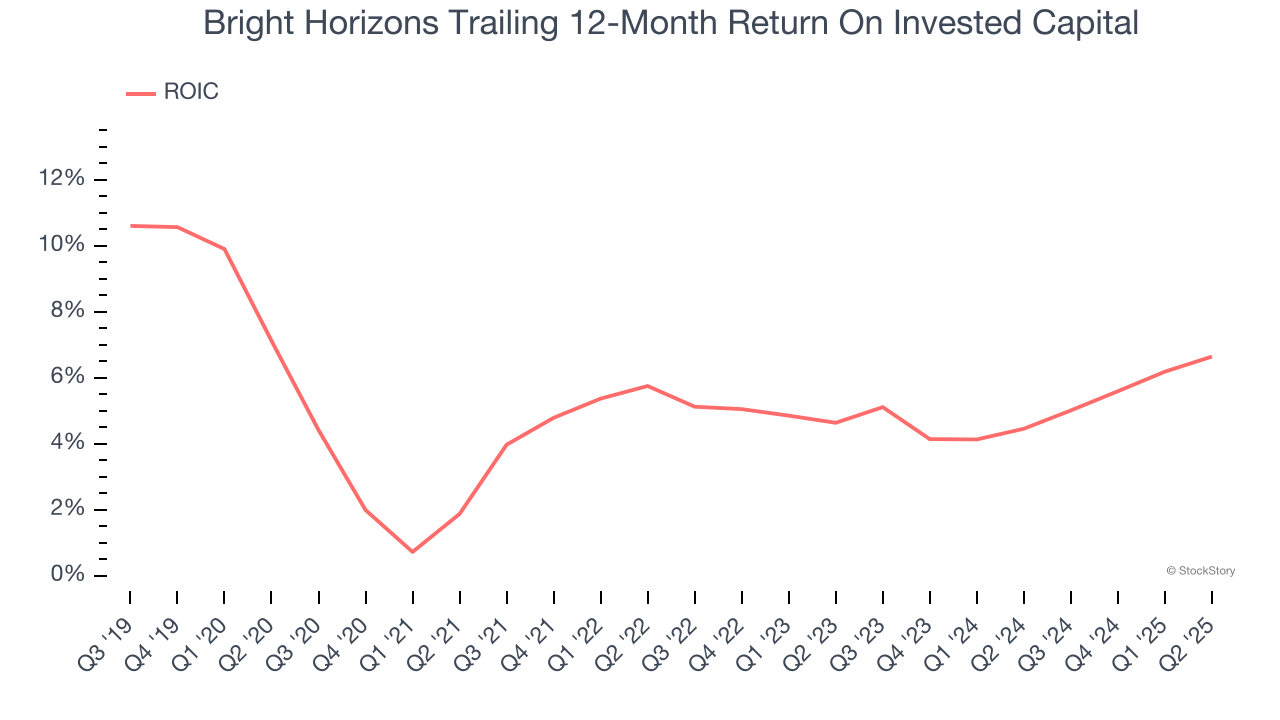
3. Previous Growth Initiatives Haven’t Impressed
Growth gives us insight into a company’s long-term potential, but how capital-efficient was that growth? A company’s ROIC explains this by showing how much operating profit it makes compared to the money it has raised (debt and equity).
Bright Horizons historically did a mediocre job investing in profitable growth initiatives. Its five-year average ROIC was 4.7%, lower than the typical cost of capital (how much it costs to raise money) for consumer discretionary companies.
Final Judgment
Bright Horizons falls short of our quality standards. Following the recent decline, the stock trades at 25.4× forward P/E (or $110.42 per share). This multiple tells us a lot of good news is priced in - we think there are better opportunities elsewhere. We’d recommend looking at our favorite semiconductor picks and shovels play.
Stocks We Like More Than Bright Horizons
Donald Trump’s April 2025 "Liberation Day" tariffs sent markets into a tailspin, but stocks have since rebounded strongly, proving that knee-jerk reactions often create the best buying opportunities.
The smart money is already positioning for the next leg up. Don’t miss out on the recovery - check out our Top 5 Strong Momentum Stocks for this week. This is a curated list of our High Quality stocks that have generated a market-beating return of 183% over the last five years (as of March 31st 2025).
Stocks that made our list in 2020 include now familiar names such as Nvidia (+1,545% between March 2020 and March 2025) as well as under-the-radar businesses like the once-micro-cap company Kadant (+351% five-year return). Find your next big winner with StockStory today.
StockStory is growing and hiring equity analyst and marketing roles. Are you a 0 to 1 builder passionate about the markets and AI? See the open roles here.