Penguin Solutions’s 39.4% return over the past six months has outpaced the S&P 500 by 23%, and its stock price has climbed to $26.33 per share. This was partly due to its solid quarterly results, and the run-up might have investors contemplating their next move.
Is now the time to buy Penguin Solutions, or should you be careful about including it in your portfolio? Check out our in-depth research report to see what our analysts have to say, it’s free.
Why Do We Think Penguin Solutions Will Underperform?
Despite the momentum, we're swiping left on Penguin Solutions for now. Here are three reasons we avoid PENG and a stock we'd rather own.
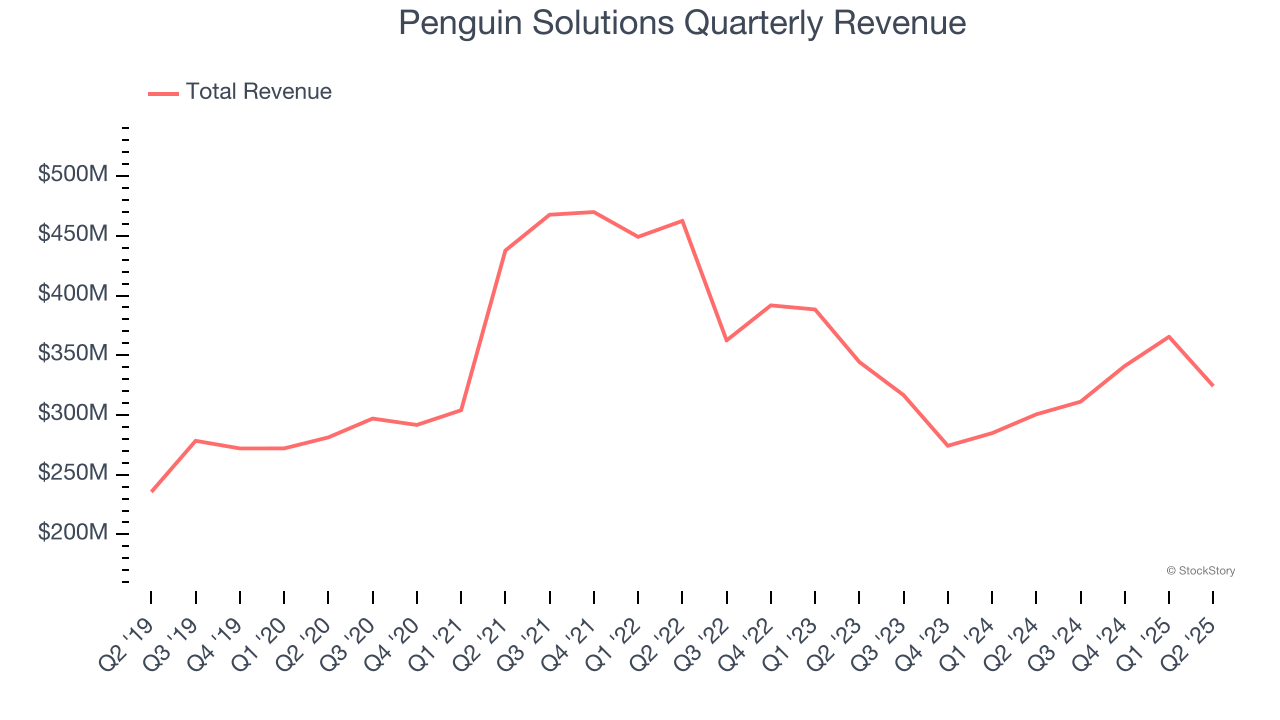
1. Long-Term Revenue Growth Disappoints
A company’s long-term sales performance can indicate its overall quality. Any business can put up a good quarter or two, but the best consistently grow over the long haul. Unfortunately, Penguin Solutions’s 4% annualized revenue growth over the last five years was sluggish. This was below our standard for the semiconductor sector. Semiconductors are a cyclical industry, and long-term investors should be prepared for periods of high growth followed by periods of revenue contractions.
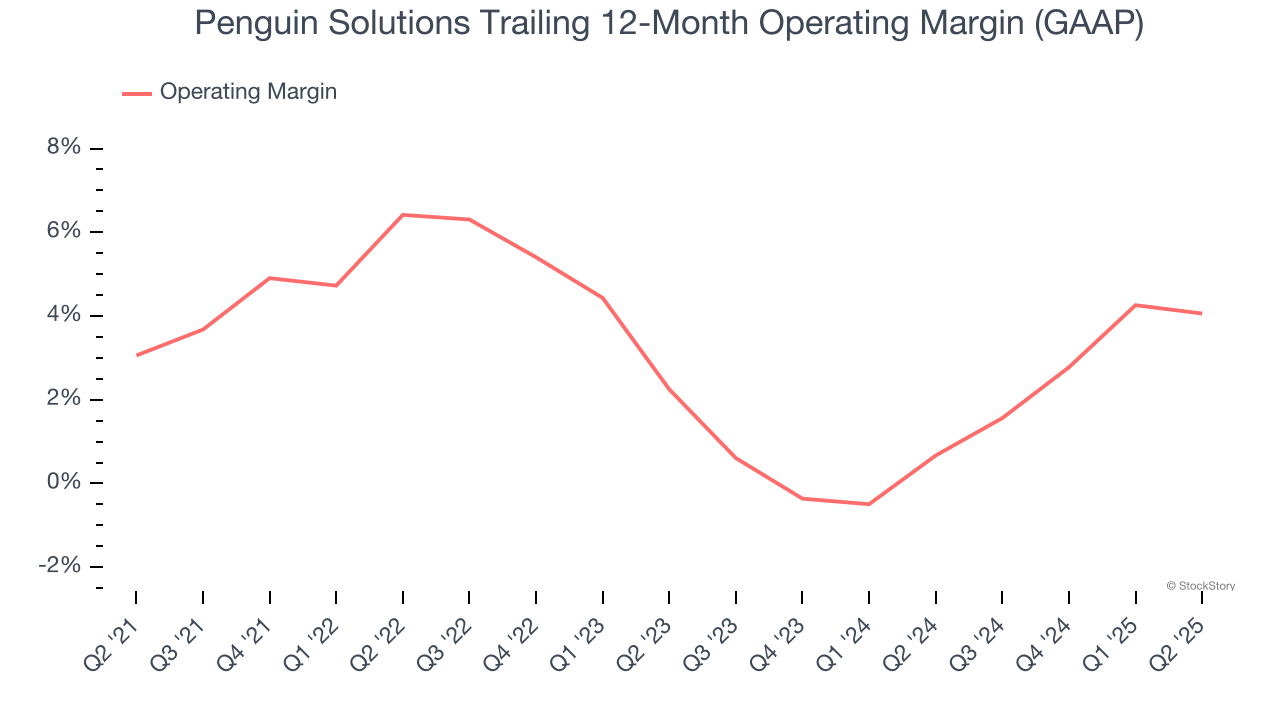
2. Weak Operating Margin Could Cause Trouble
Operating margin is one of the best measures of profitability because it tells us how much money a company takes home after procuring and manufacturing its products, marketing and selling those products, and most importantly, keeping them relevant through research and development.
Penguin Solutions was profitable over the last two years but held back by its large cost base. Its average operating margin of 2.5% was among the worst in the semiconductor sector. This result isn’t too surprising given its low gross margin as a starting point.
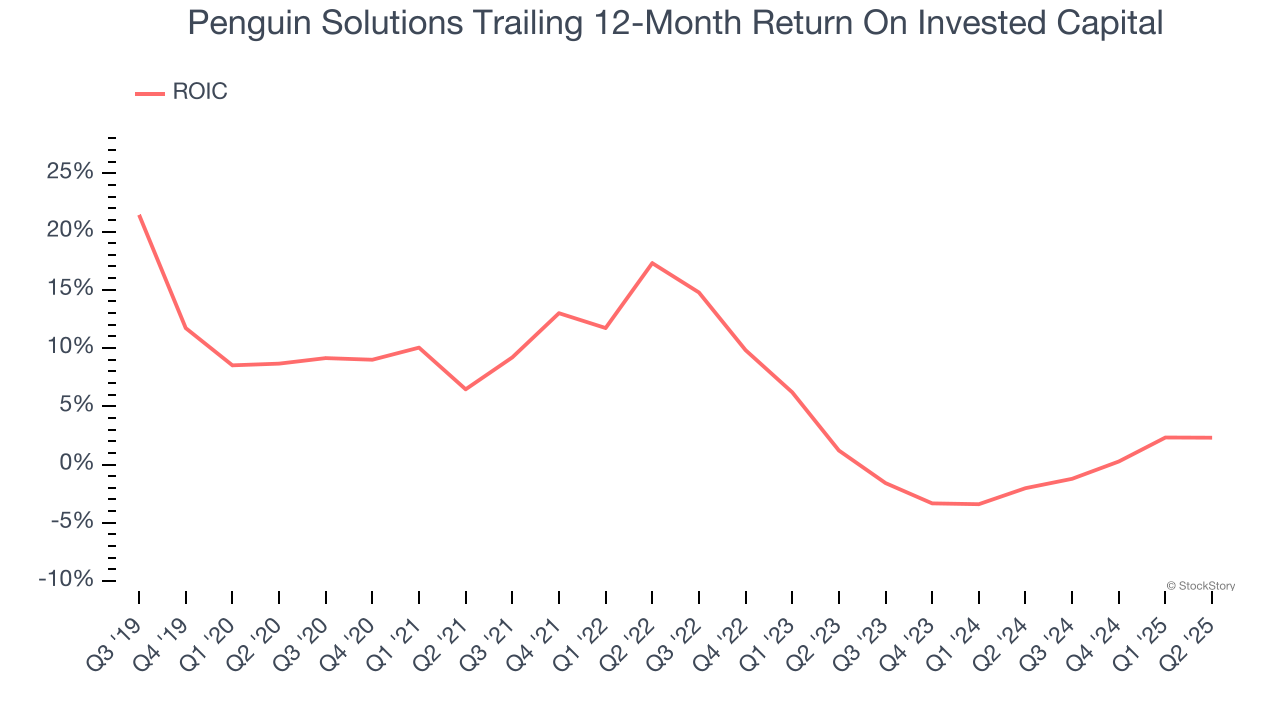
3. Previous Growth Initiatives Haven’t Impressed
Growth gives us insight into a company’s long-term potential, but how capital-efficient was that growth? A company’s ROIC explains this by showing how much operating profit it makes compared to the money it has raised (debt and equity).
Penguin Solutions historically did a mediocre job investing in profitable growth initiatives. Its five-year average ROIC was 5%, somewhat low compared to the best semiconductor companies that consistently pump out 35%+.
Final Judgment
Penguin Solutions falls short of our quality standards. With its shares topping the market in recent months, the stock trades at 15.5× forward P/E (or $26.33 per share). This multiple tells us a lot of good news is priced in - we think there are better opportunities elsewhere. We’d suggest looking at a fast-growing restaurant franchise with an A+ ranch dressing sauce.
Stocks We Would Buy Instead of Penguin Solutions
Donald Trump’s April 2025 "Liberation Day" tariffs sent markets into a tailspin, but stocks have since rebounded strongly, proving that knee-jerk reactions often create the best buying opportunities.
The smart money is already positioning for the next leg up. Don’t miss out on the recovery - check out our Top 5 Strong Momentum Stocks for this week. This is a curated list of our High Quality stocks that have generated a market-beating return of 183% over the last five years (as of March 31st 2025).
Stocks that made our list in 2020 include now familiar names such as Nvidia (+1,545% between March 2020 and March 2025) as well as under-the-radar businesses like the once-small-cap company Exlservice (+354% five-year return). Find your next big winner with StockStory today.
StockStory is growing and hiring equity analyst and marketing roles. Are you a 0 to 1 builder passionate about the markets and AI? See the open roles here.