DraftKings trades at $43.36 and has moved in lockstep with the market. Its shares have returned 12.5% over the last six months while the S&P 500 has gained 16.8%.
Is now the time to buy DKNG? Find out in our full research report, it’s free.
Why Does DraftKings Spark Debate?
Getting its start in daily fantasy sports, DraftKings (NASDAQ: DKNG) is a digital sports entertainment and gaming company.
Two Positive Attributes:
1. Growth in Monthly Unique Players Shows Increasing Demand
Revenue growth can be broken down into changes in price and volume (for companies like DraftKings, our preferred volume metric is monthly unique players). While both are important, the latter is the most critical to analyze because prices have a ceiling.
DraftKings’s monthly unique players punched in at 3.3 million in the latest quarter, and over the last two years, averaged 34.2% year-on-year growth. This performance was fantastic and shows its brand have a unique value proposition. 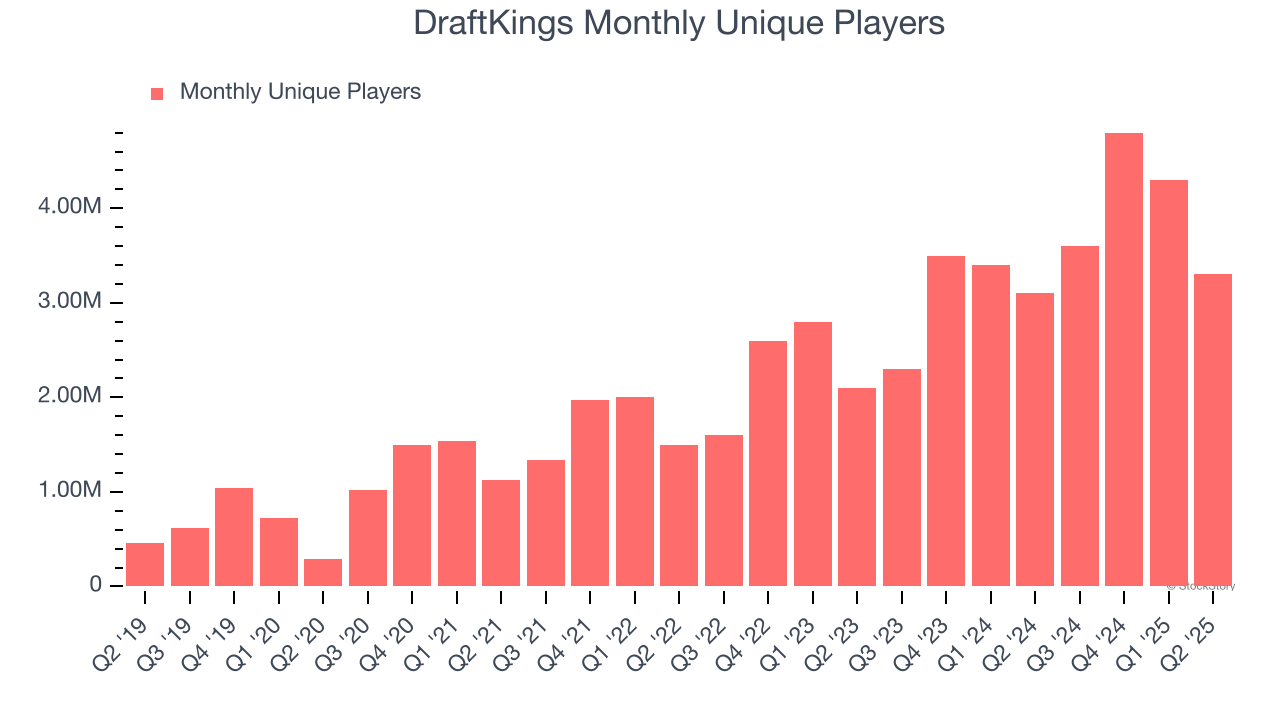
2. Projected Revenue Growth Is Remarkable
Forecasted revenues by Wall Street analysts signal a company’s potential. Predictions may not always be accurate, but accelerating growth typically boosts valuation multiples and stock prices while slowing growth does the opposite, though some deceleration is natural as businesses become larger.
Over the next 12 months, sell-side analysts expect DraftKings’s revenue to rise by 27.7%. While this projection is below its 34.2% annualized growth rate for the past two years, it is eye-popping and indicates the market sees success for its products and services.
One Reason to be Careful:
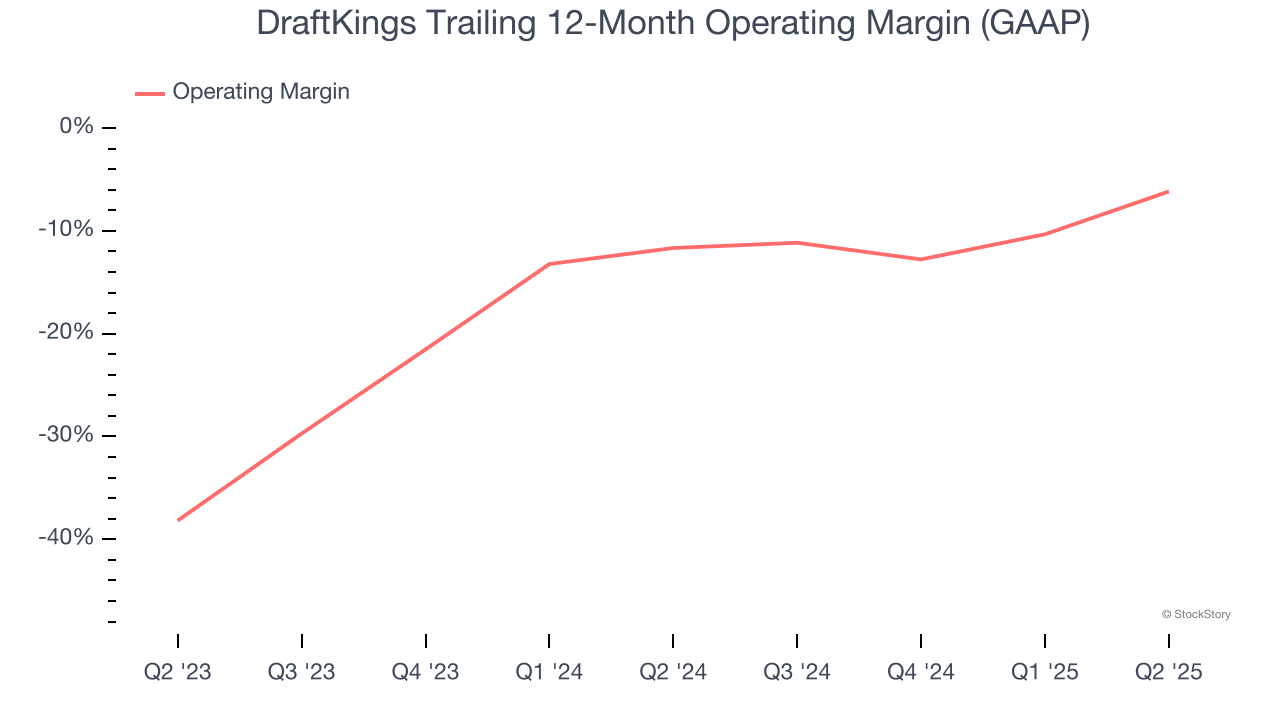
Operating Losses Sound the Alarms
Operating margin is an important measure of profitability as it shows the portion of revenue left after accounting for all core expenses – everything from the cost of goods sold to advertising and wages. It’s also useful for comparing profitability across companies with different levels of debt and tax rates because it excludes interest and taxes.
DraftKings’s operating margin has risen over the last 12 months, but it still averaged negative 8.6% over the last two years. This is due to its large expense base and inefficient cost structure. It might have a shot at long-term profitability if it can scale quickly and gain operating leverage.
Final Judgment
DraftKings’s positive characteristics outweigh the negatives, but at $43.36 per share (or 21.2× forward EV-to-EBITDA), is now the time to initiate a position? See for yourself in our comprehensive research report, it’s free.
Stocks We Like Even More Than DraftKings
Donald Trump’s April 2025 "Liberation Day" tariffs sent markets into a tailspin, but stocks have since rebounded strongly, proving that knee-jerk reactions often create the best buying opportunities.
The smart money is already positioning for the next leg up. Don’t miss out on the recovery - check out our Top 6 Stocks for this week. This is a curated list of our High Quality stocks that have generated a market-beating return of 183% over the last five years (as of March 31st 2025).
Stocks that made our list in 2020 include now familiar names such as Nvidia (+1,545% between March 2020 and March 2025) as well as under-the-radar businesses like the once-small-cap company Exlservice (+354% five-year return). Find your next big winner with StockStory today.
StockStory is growing and hiring equity analyst and marketing roles. Are you a 0 to 1 builder passionate about the markets and AI? See the open roles here.