Papa John's has been treading water for the past six months, holding steady at $45.93. The stock also fell short of the S&P 500’s 16.8% gain during that period.
Is there a buying opportunity in Papa John's, or does it present a risk to your portfolio? Check out our in-depth research report to see what our analysts have to say, it’s free.
Why Is Papa John's Not Exciting?
We're cautious about Papa John's. Here are three reasons there are better opportunities than PZZA and a stock we'd rather own.
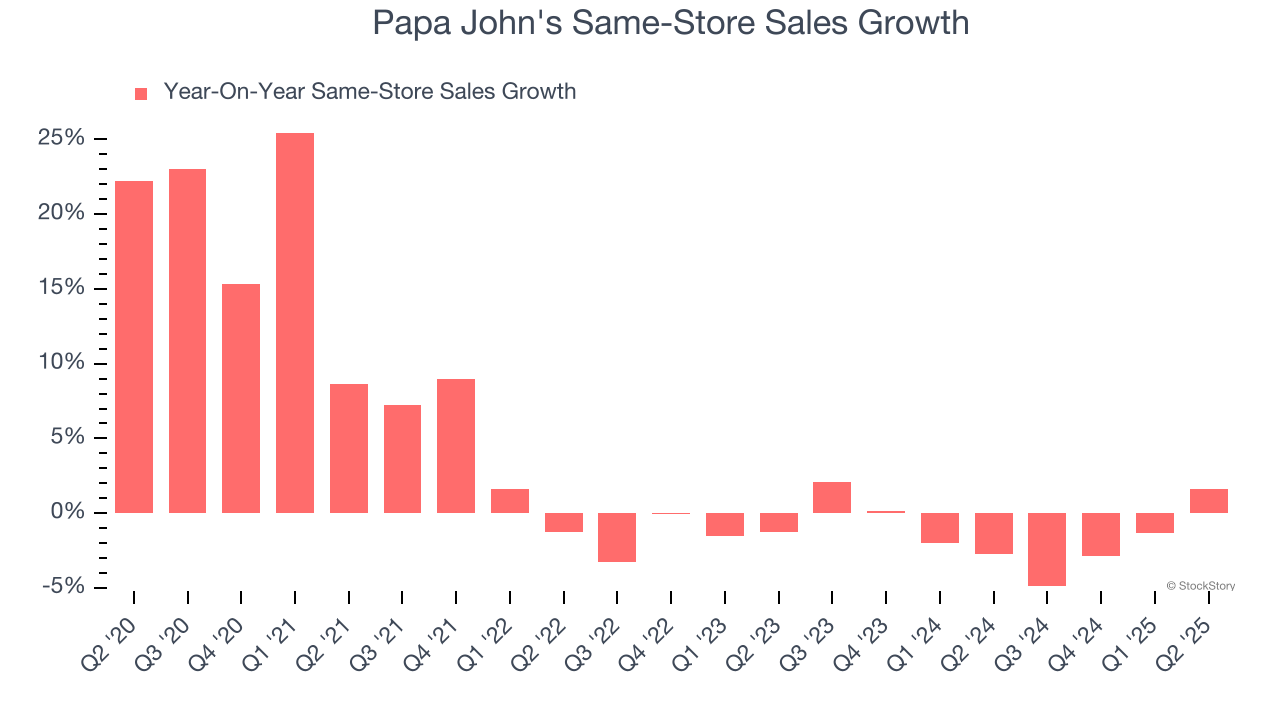
1. Shrinking Same-Store Sales Indicate Waning Demand
Same-store sales is a key performance indicator used to measure organic growth at restaurants open for at least a year.
Papa John’s demand has been shrinking over the last two years as its same-store sales have averaged 1.2% annual declines.
2. Projected Revenue Growth Is Slim
Forecasted revenues by Wall Street analysts signal a company’s potential. Predictions may not always be accurate, but accelerating growth typically boosts valuation multiples and stock prices while slowing growth does the opposite.
Over the next 12 months, sell-side analysts expect Papa John’s revenue to rise by 1.6%, a deceleration versus This projection doesn't excite us and indicates its menu offerings will see some demand headwinds.
3. Low Gross Margin Reveals Weak Structural Profitability
Gross profit margins are an important measure of a restaurant’s pricing power and differentiation, whether it be the dining experience or quality and taste of food.
Papa John's has bad unit economics for a restaurant company, signaling it operates in a competitive market and has little room for error if demand unexpectedly falls. As you can see below, it averaged a 14.8% gross margin over the last two years. Said differently, Papa John's had to pay a chunky $85.21 to its suppliers for every $100 in revenue. 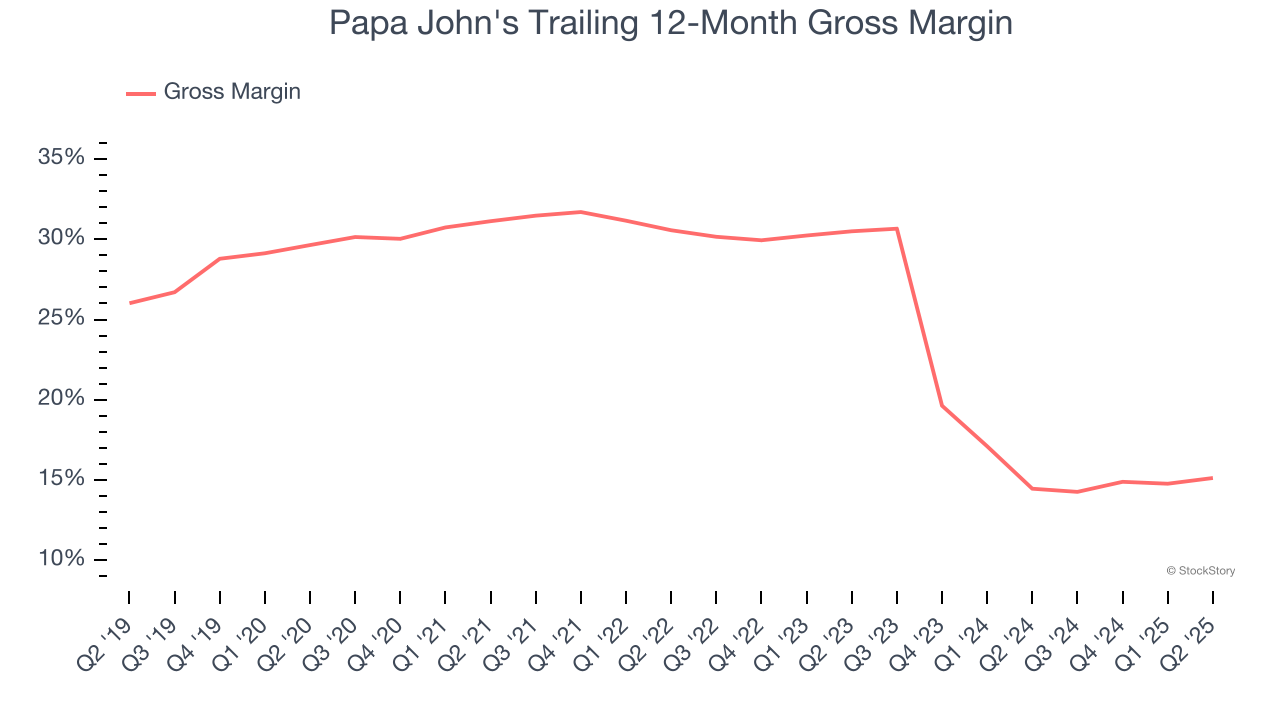
Final Judgment
Papa John's isn’t a terrible business, but it doesn’t pass our bar. With its shares trailing the market in recent months, the stock trades at 22× forward P/E (or $45.93 per share). While this valuation is reasonable, we don’t really see a big opportunity at the moment. We're pretty confident there are superior stocks to buy right now. Let us point you toward one of our top digital advertising picks.
Stocks We Like More Than Papa John's
When Trump unveiled his aggressive tariff plan in April 2025, markets tanked as investors feared a full-blown trade war. But those who panicked and sold missed the subsequent rebound that’s already erased most losses.
Don’t let fear keep you from great opportunities and take a look at Top 9 Market-Beating Stocks. This is a curated list of our High Quality stocks that have generated a market-beating return of 183% over the last five years (as of March 31st 2025).
Stocks that made our list in 2020 include now familiar names such as Nvidia (+1,545% between March 2020 and March 2025) as well as under-the-radar businesses like the once-small-cap company Exlservice (+354% five-year return). Find your next big winner with StockStory today.
StockStory is growing and hiring equity analyst and marketing roles. Are you a 0 to 1 builder passionate about the markets and AI? See the open roles here.