ScanSource has followed the market’s trajectory closely, rising in tandem with the S&P 500 over the past six months. The stock has climbed by 19.2% to $44.30 per share while the index has gained 16.8%.
Is there a buying opportunity in ScanSource, or does it present a risk to your portfolio? Get the full stock story straight from our expert analysts, it’s free.
Why Do We Think ScanSource Will Underperform?
We're swiping left on ScanSource for now. Here are three reasons there are better opportunities than SCSC and a stock we'd rather own.
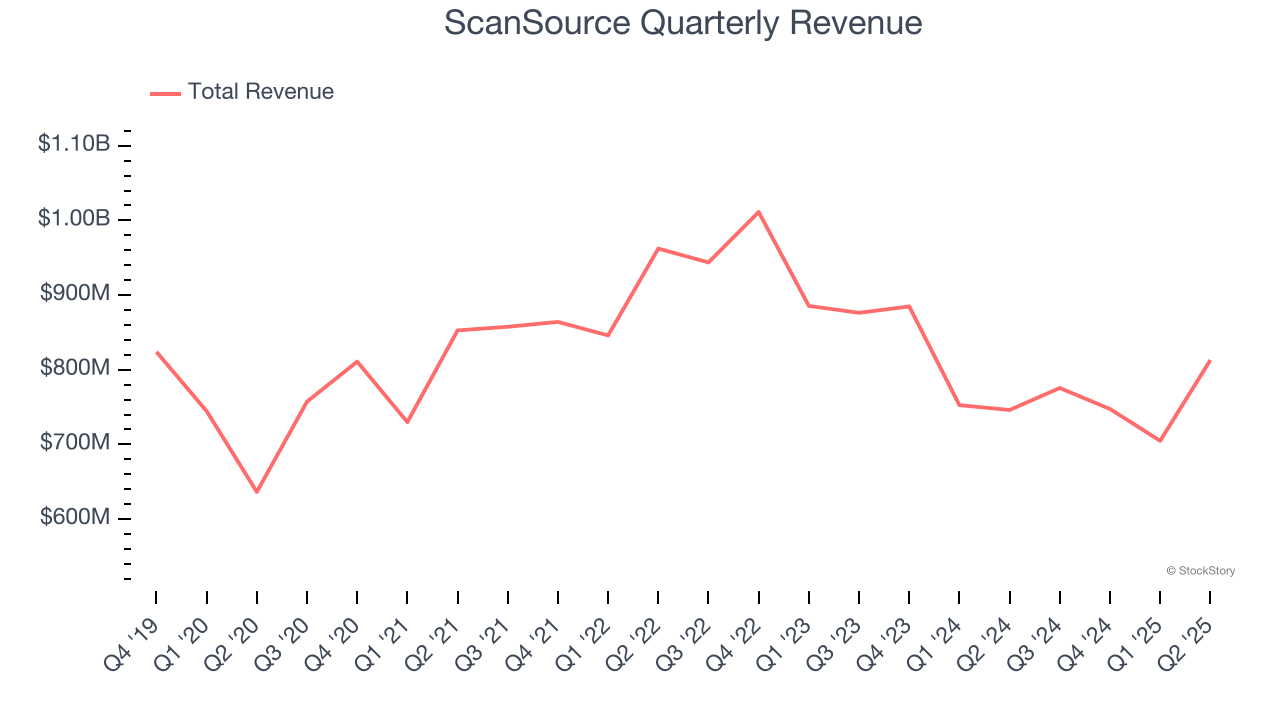
1. Long-Term Revenue Growth Flatter Than a Pancake
Examining a company’s long-term performance can provide clues about its quality. Any business can have short-term success, but a top-tier one grows for years. Unfortunately, ScanSource struggled to consistently increase demand as its $3.04 billion of sales for the trailing 12 months was close to its revenue five years ago. This wasn’t a great result and is a sign of poor business quality.
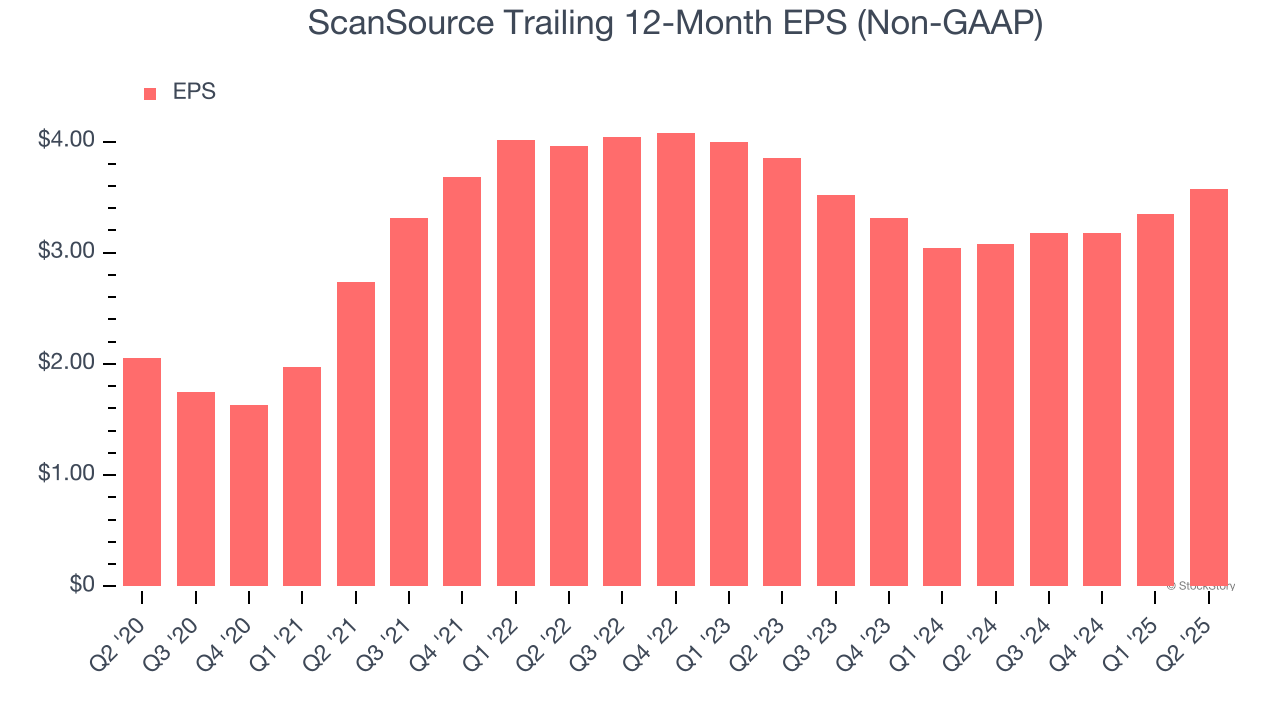
2. EPS Took a Dip Over the Last Two Years
Although long-term earnings trends give us the big picture, we like to analyze EPS over a shorter period to see if we are missing a change in the business.
Sadly for ScanSource, its EPS and revenue declined by 3.7% and 11.4% annually over the last two years. We tend to steer our readers away from companies with falling revenue and EPS, where diminishing earnings could imply changing secular trends and preferences. If the tide turns unexpectedly, ScanSource’s low margin of safety could leave its stock price susceptible to large downswings.
3. Previous Growth Initiatives Haven’t Impressed
Growth gives us insight into a company’s long-term potential, but how capital-efficient was that growth? Enter ROIC, a metric showing how much operating profit a company generates relative to the money it has raised (debt and equity).
ScanSource historically did a mediocre job investing in profitable growth initiatives. Its five-year average ROIC was 8.1%, somewhat low compared to the best business services companies that consistently pump out 25%+.
Final Judgment
We see the value of companies helping their customers, but in the case of ScanSource, we’re out. That said, the stock currently trades at 11.7× forward P/E (or $44.30 per share). This valuation tells us it’s a bit of a market darling with a lot of good news priced in - you can find more timely opportunities elsewhere. We’d recommend looking at a dominant Aerospace business that has perfected its M&A strategy.
Stocks We Would Buy Instead of ScanSource
Donald Trump’s April 2025 "Liberation Day" tariffs sent markets into a tailspin, but stocks have since rebounded strongly, proving that knee-jerk reactions often create the best buying opportunities.
The smart money is already positioning for the next leg up. Don’t miss out on the recovery - check out our Top 9 Market-Beating Stocks. This is a curated list of our High Quality stocks that have generated a market-beating return of 183% over the last five years (as of March 31st 2025).
Stocks that made our list in 2020 include now familiar names such as Nvidia (+1,545% between March 2020 and March 2025) as well as under-the-radar businesses like the once-micro-cap company Tecnoglass (+1,754% five-year return). Find your next big winner with StockStory today.
StockStory is growing and hiring equity analyst and marketing roles. Are you a 0 to 1 builder passionate about the markets and AI? See the open roles here.