First Horizon trades at $23.23 per share and has stayed right on track with the overall market, gaining 20.8% over the last six months. At the same time, the S&P 500 has returned 16.8%.
Is there a buying opportunity in First Horizon, or does it present a risk to your portfolio? Check out our in-depth research report to see what our analysts have to say, it’s free.
Why Is First Horizon Not Exciting?
We're cautious about First Horizon. Here are three reasons why FHN doesn't excite us and a stock we'd rather own.
1. Revenue Tumbling Downwards
Long-term growth is the most important, but within financials, a stretched historical view may miss recent interest rate changes and market returns. First Horizon’s recent performance marks a sharp pivot from its five-year trend as its revenue has shown annualized declines of 6.3% over the last two years. 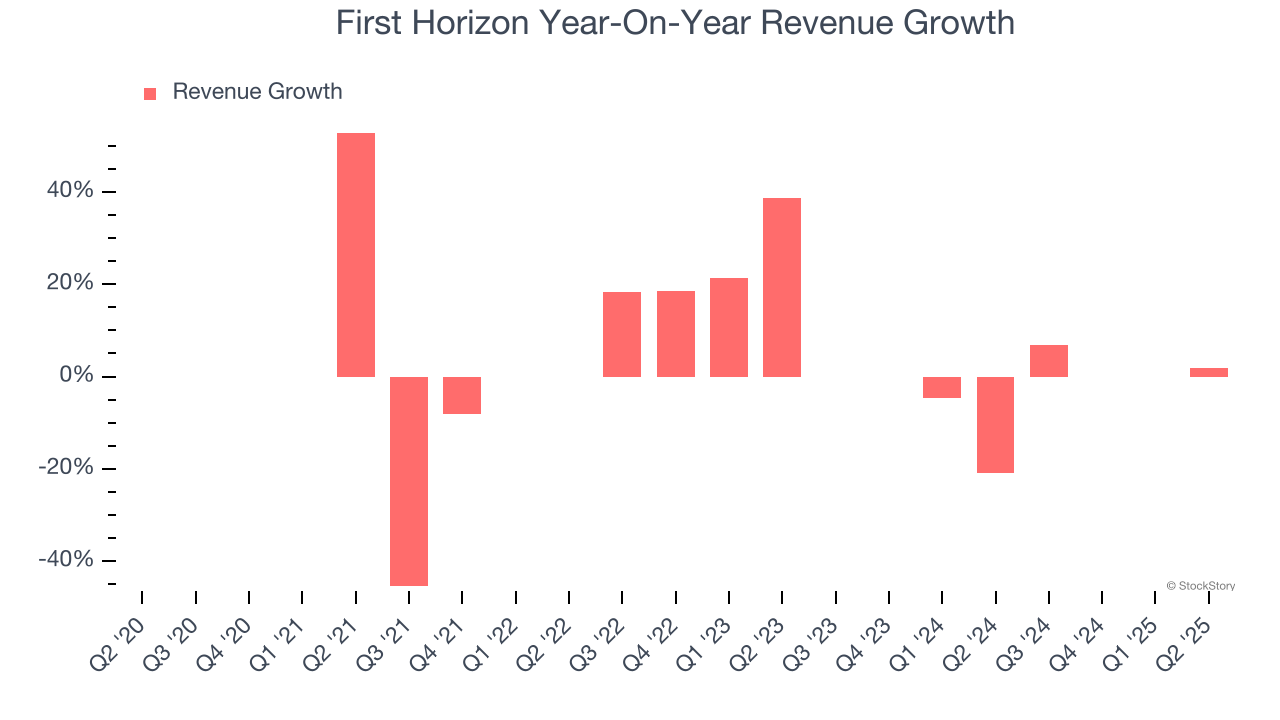 Note: Quarters not shown were determined to be outliers, impacted by outsized investment gains/losses that are not indicative of the recurring fundamentals of the business.
2. Projected Net Interest Income Growth Is Slim
Forecasted net interest income by Wall Street analysts signals a company’s potential. Predictions may not always be accurate, but accelerating growth typically boosts valuation multiples and stock prices while slowing growth does the opposite.
Over the next 12 months, sell-side analysts expect First Horizon’s net interest income to rise by 3.4%.
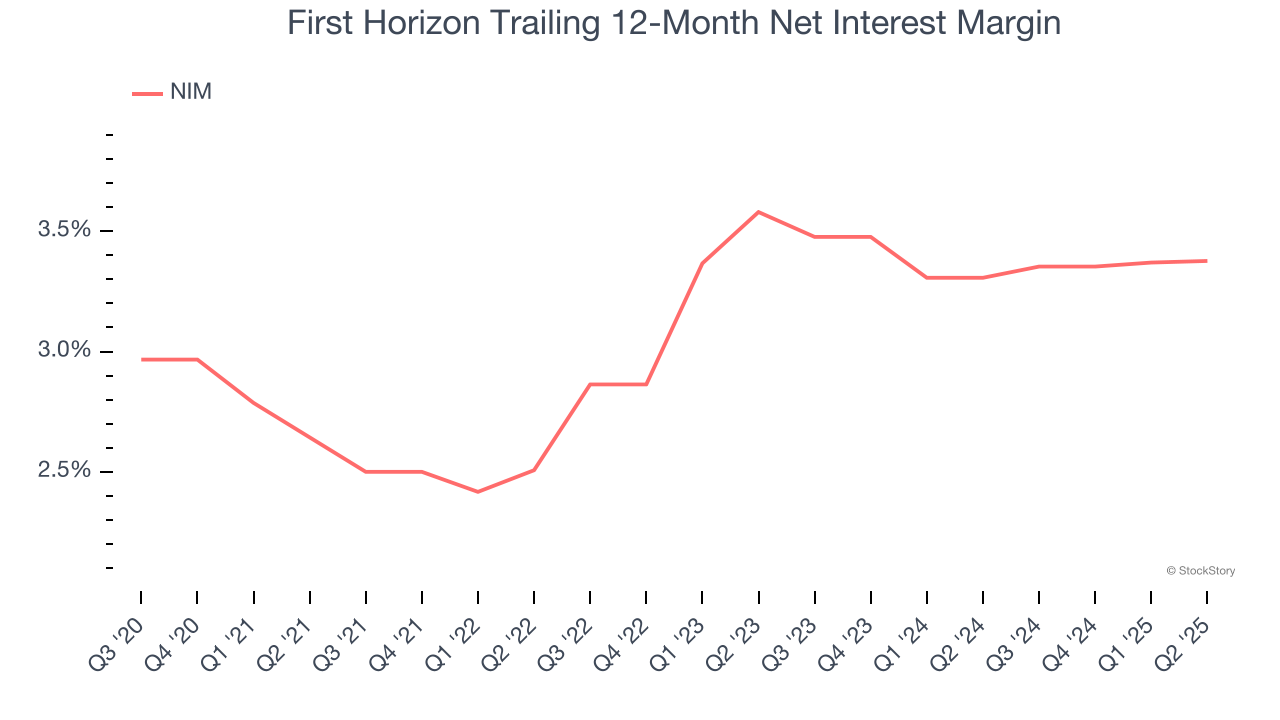
3. Net Interest Margin Dropping
The net interest margin (NIM) is a key profitability indicator that measures the difference between what a bank earns on its loans and what it pays on its deposits. This metric measures how efficiently one can generate income from its core lending activities.
Over the past two years, First Horizon’s net interest margin averaged 3.3%. Its margin also contracted by 20.3 basis points (100 basis points = 1 percentage point) over that period.
This decline was a headwind for its net interest income. While prevailing rates are a major determinant of net interest margin changes over time, the decline could mean that First Horizon either faced competition for loans and deposits or experienced a negative mix shift in its balance sheet composition.
Final Judgment
First Horizon isn’t a terrible business, but it doesn’t pass our bar. That said, the stock currently trades at 1.3× forward P/B (or $23.23 per share). Beauty is in the eye of the beholder, but we don’t really see a big opportunity at the moment. We're fairly confident there are better stocks to buy right now. We’d suggest looking at one of our top digital advertising picks.
High-Quality Stocks for All Market Conditions
When Trump unveiled his aggressive tariff plan in April 2025, markets tanked as investors feared a full-blown trade war. But those who panicked and sold missed the subsequent rebound that’s already erased most losses.
Don’t let fear keep you from great opportunities and take a look at Top 5 Growth Stocks for this month. This is a curated list of our High Quality stocks that have generated a market-beating return of 183% over the last five years (as of March 31st 2025).
Stocks that made our list in 2020 include now familiar names such as Nvidia (+1,545% between March 2020 and March 2025) as well as under-the-radar businesses like the once-small-cap company Comfort Systems (+782% five-year return). Find your next big winner with StockStory today.
StockStory is growing and hiring equity analyst and marketing roles. Are you a 0 to 1 builder passionate about the markets and AI? See the open roles here.