Even though John Bean (currently trading at $135.72 per share) has gained 7.4% over the last six months, it has lagged the S&P 500’s 16.8% return during that period. This might have investors contemplating their next move.
Is there a buying opportunity in John Bean, or does it present a risk to your portfolio? Get the full breakdown from our expert analysts, it’s free.
Why Is John Bean Not Exciting?
We're sitting this one out for now. Here are three reasons why JBTM doesn't excite us and a stock we'd rather own.
1. Slow Organic Growth Suggests Waning Demand In Core Business
In addition to reported revenue, organic revenue is a useful data point for analyzing General Industrial Machinery companies. This metric gives visibility into John Bean’s core business because it excludes one-time events such as mergers, acquisitions, and divestitures along with foreign currency fluctuations - non-fundamental factors that can manipulate the income statement.
Over the last two years, John Bean’s organic revenue averaged 1.7% year-on-year growth. This performance was underwhelming and suggests it may need to improve its products, pricing, or go-to-market strategy, which can add an extra layer of complexity to its operations. 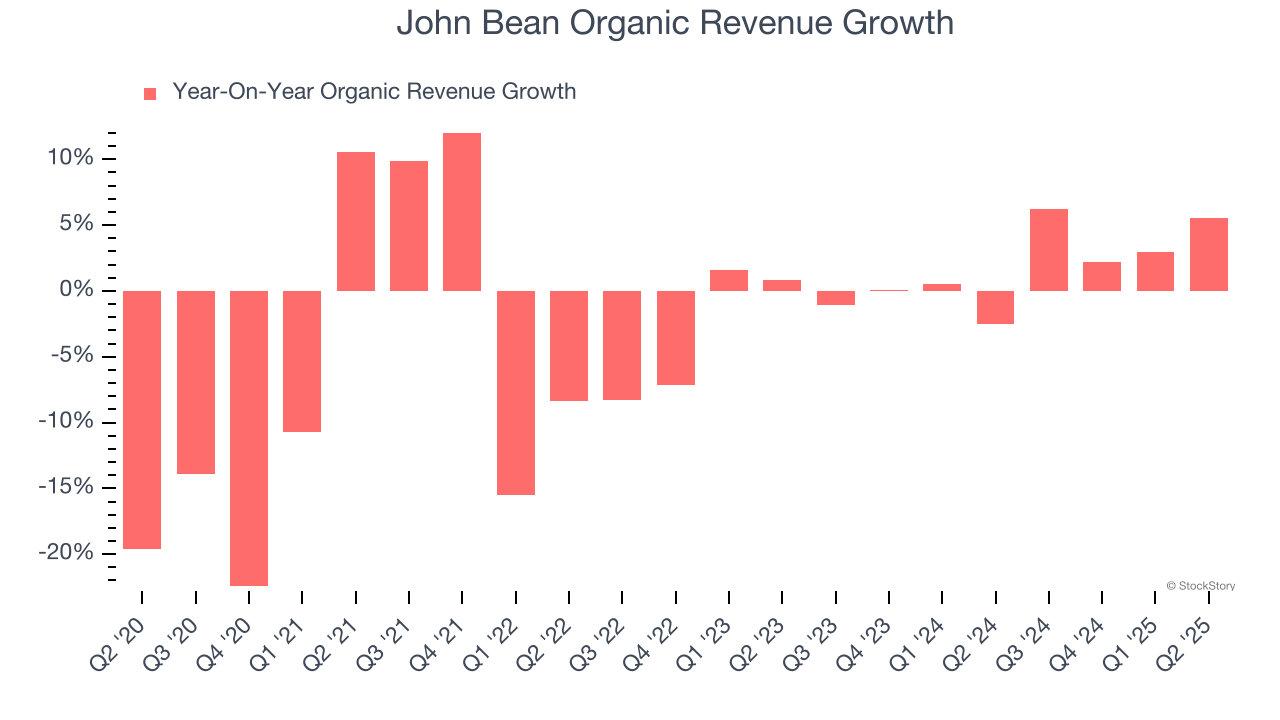
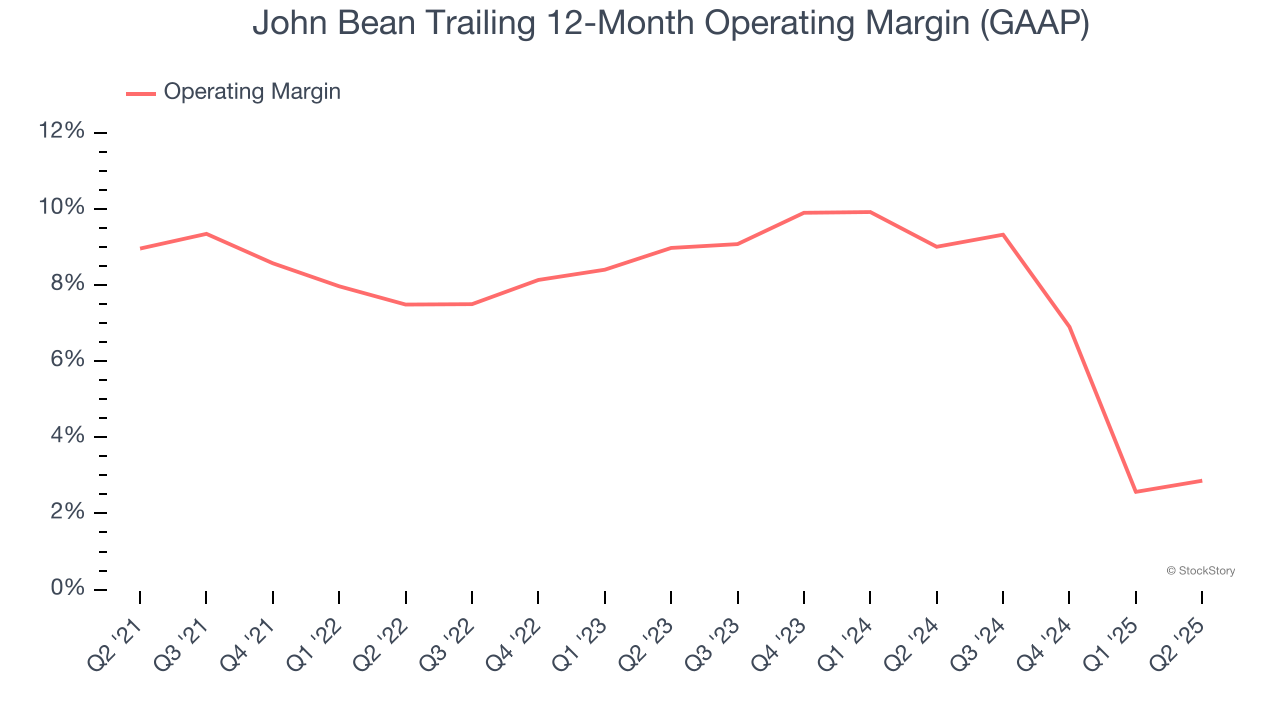
2. Shrinking Operating Margin
Operating margin is one of the best measures of profitability because it tells us how much money a company takes home after procuring and manufacturing its products, marketing and selling those products, and most importantly, keeping them relevant through research and development.
Looking at the trend in its profitability, John Bean’s operating margin decreased by 6.1 percentage points over the last five years. This raises questions about the company’s expense base because its revenue growth should have given it leverage on its fixed costs, resulting in better economies of scale and profitability. John Bean’s performance was poor no matter how you look at it - it shows that costs were rising and it couldn’t pass them onto its customers. Its operating margin for the trailing 12 months was 2.9%.
3. Previous Growth Initiatives Haven’t Impressed
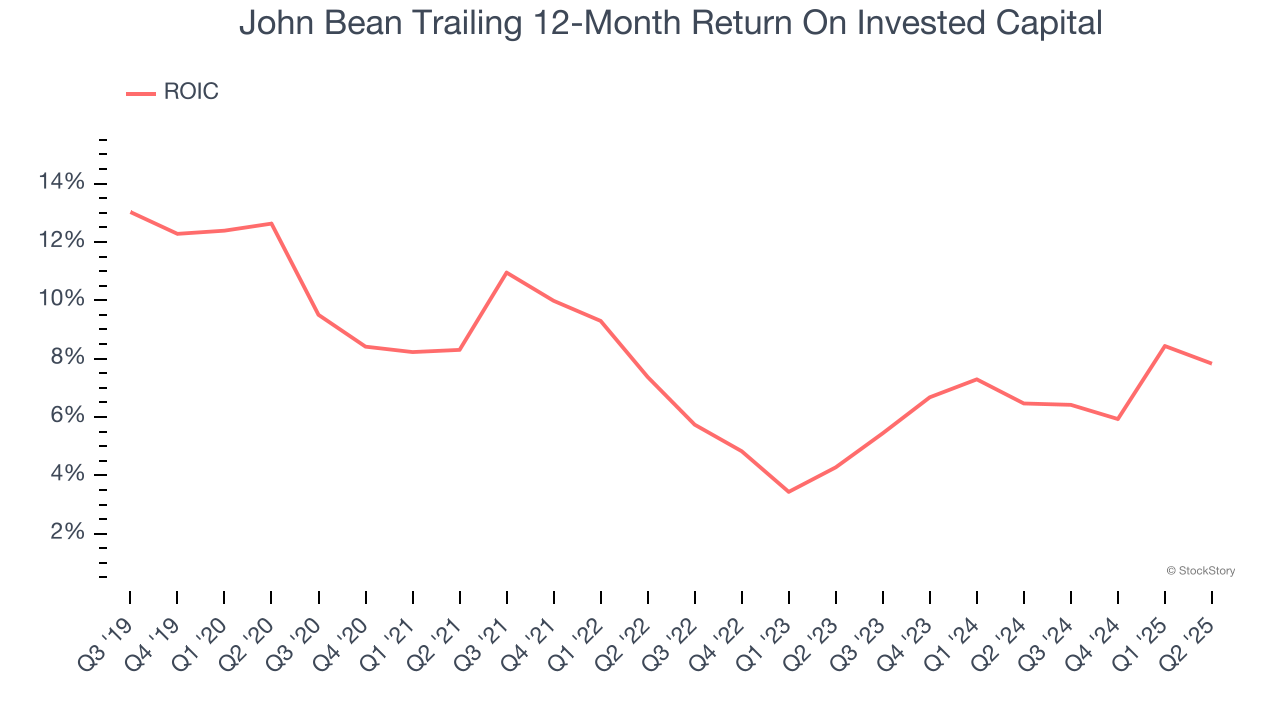
Growth gives us insight into a company’s long-term potential, but how capital-efficient was that growth? Enter ROIC, a metric showing how much operating profit a company generates relative to the money it has raised (debt and equity).
John Bean historically did a mediocre job investing in profitable growth initiatives. Its five-year average ROIC was 6.8%, somewhat low compared to the best industrials companies that consistently pump out 20%+.
Final Judgment
John Bean isn’t a terrible business, but it doesn’t pass our bar. With its shares lagging the market recently, the stock trades at 20.3× forward P/E (or $135.72 per share). This valuation multiple is fair, but we don’t have much faith in the company. We're fairly confident there are better investments elsewhere. Let us point you toward one of our all-time favorite software stocks.
High-Quality Stocks for All Market Conditions
Trump’s April 2025 tariff bombshell triggered a massive market selloff, but stocks have since staged an impressive recovery, leaving those who panic sold on the sidelines.
Take advantage of the rebound by checking out our Top 9 Market-Beating Stocks. This is a curated list of our High Quality stocks that have generated a market-beating return of 183% over the last five years (as of March 31st 2025).
Stocks that made our list in 2020 include now familiar names such as Nvidia (+1,545% between March 2020 and March 2025) as well as under-the-radar businesses like the once-micro-cap company Tecnoglass (+1,754% five-year return). Find your next big winner with StockStory today.
StockStory is growing and hiring equity analyst and marketing roles. Are you a 0 to 1 builder passionate about the markets and AI? See the open roles here.