Quarterly earnings results are a good time to check in on a company’s progress, especially compared to its peers in the same sector. Today we are looking at Ally Financial (NYSE: ALLY) and the best and worst performers in the consumer finance industry.
Consumer finance companies provide loans and credit products to individuals. Growth drivers include increasing consumer spending, financial inclusion initiatives in developing markets, and digital lending platforms reducing distribution costs. Challenges include credit risk during economic downturns, regulatory scrutiny of lending practices, and intensifying competition from traditional banks and fintech firms offering innovative credit solutions.
The 19 consumer finance stocks we track reported a very strong Q2. As a group, revenues beat analysts’ consensus estimates by 4.5% while next quarter’s revenue guidance was 1.5% below.
Thankfully, share prices of the companies have been resilient as they are up 7.3% on average since the latest earnings results.
Ally Financial (NYSE: ALLY)
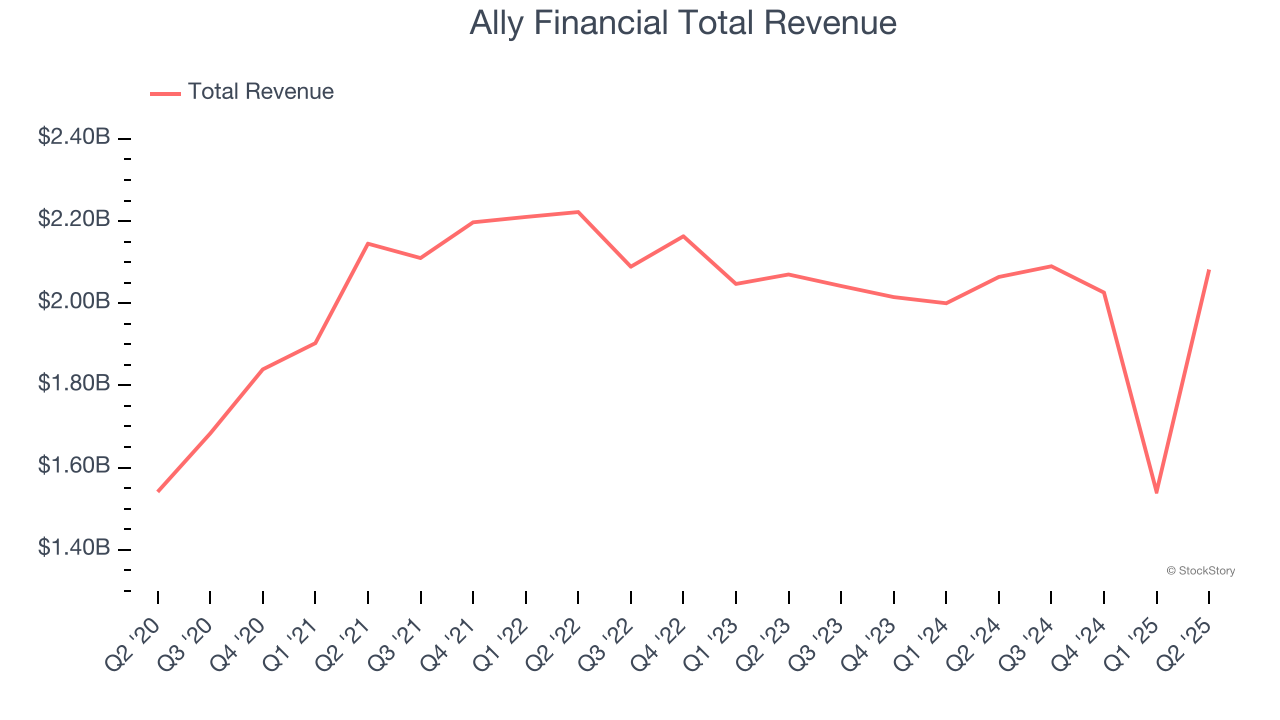
Born from the former GMAC (General Motors Acceptance Corporation) and rebranded in 2010, Ally Financial (NYSE: ALLY) operates a digital-first bank offering auto financing, insurance, mortgage lending, and investment services to consumers and commercial clients.
Ally Financial reported revenues of $2.08 billion, flat year on year. This print exceeded analysts’ expectations by 2.3%. Overall, it was an exceptional quarter for the company with a beat of analysts’ EPS and net interest margin estimates.
Interestingly, the stock is up 11.3% since reporting and currently trades at $44.80.
Is now the time to buy Ally Financial? Access our full analysis of the earnings results here, it’s free.
Best Q2: Dave (NASDAQ: DAVE)
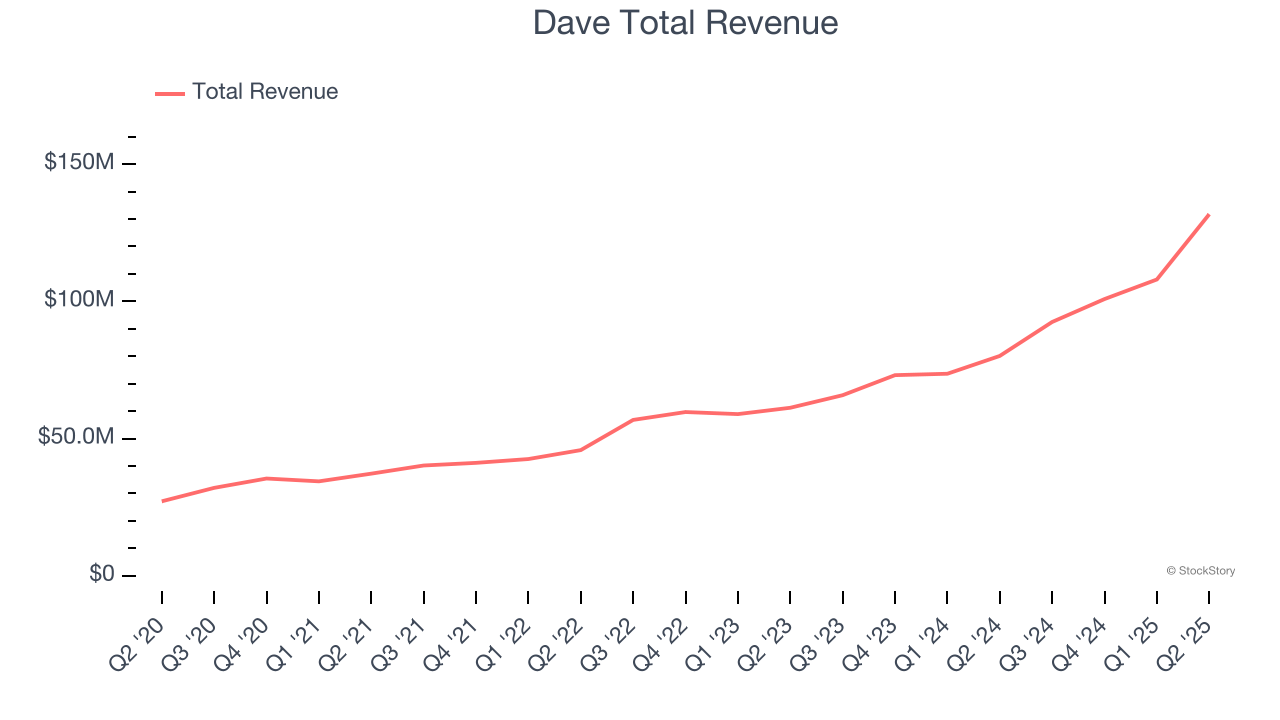
Named after the biblical David fighting financial Goliaths, Dave (NASDAQ: DAVE) is a digital financial services platform that helps Americans living paycheck to paycheck with cash advances, banking services, and tools to improve their financial health.
Dave reported revenues of $131.8 million, up 64.5% year on year, outperforming analysts’ expectations by 16%. The business had an incredible quarter with a beat of analysts’ EPS estimates.
Although it had a fine quarter compared its peers, the market seems unhappy with the results as the stock is down 4.2% since reporting. It currently trades at $229.
Is now the time to buy Dave? Access our full analysis of the earnings results here, it’s free.
Slowest Q2: Sallie Mae (NASDAQ: SLM)
Originally created as a government-sponsored enterprise before privatizing in 2004, Sallie Mae (NASDAQ: SLM) is a financial services company that provides private education loans, savings products, and educational resources to help students and families pay for college.
Sallie Mae reported revenues of $403.6 million, down 21.5% year on year, in line with analysts’ expectations. It was a softer quarter as it posted a significant miss of analysts’ EPS estimates.
Sallie Mae delivered the slowest revenue growth in the group. As expected, the stock is down 9.8% since the results and currently trades at $28.85.
Read our full analysis of Sallie Mae’s results here.
Synchrony Financial (NYSE: SYF)
Powering over 73 million active accounts and partnerships with major brands like Amazon, PayPal, and Lowe's, Synchrony Financial (NYSE: SYF) provides credit cards, installment loans, and banking products through partnerships with retailers, healthcare providers, and digital platforms.
Synchrony Financial reported revenues of $3.65 billion, down 1.8% year on year. This print missed analysts’ expectations by 1.3%. Taking a step back, it was still a strong quarter as it recorded a beat of analysts’ EPS and net interest margin estimates.
Synchrony Financial had the weakest performance against analyst estimates among its peers. The stock is up 10.4% since reporting and currently trades at $76.70.
Read our full, actionable report on Synchrony Financial here, it’s free.
Capital One (NYSE: COF)
Starting as a credit card company in 1988 before expanding into a full-service bank, Capital One (NYSE: COF) is a financial services company that offers credit cards, auto loans, banking services, and commercial lending to consumers and businesses.
Capital One reported revenues of $12.58 billion, up 32.3% year on year. This number came in 0.6% below analysts' expectations. In spite of that, it was a very strong quarter as it put up a beat of analysts’ EPS estimates and an impressive beat of analysts’ net interest margin estimates.
The stock is up 5.8% since reporting and currently trades at $229.80.
Read our full, actionable report on Capital One here, it’s free.
Market Update
The Fed’s interest rate hikes throughout 2022 and 2023 have successfully cooled post-pandemic inflation, bringing it closer to the 2% target. Inflationary pressures have eased without tipping the economy into a recession, suggesting a soft landing. This stability, paired with recent rate cuts (0.5% in September 2024 and 0.25% in November 2024), fueled a strong year for the stock market in 2024. The markets surged further after Donald Trump’s presidential victory in November, with major indices reaching record highs in the days following the election. Still, questions remain about the direction of economic policy, as potential tariffs and corporate tax changes add uncertainty for 2025.
Want to invest in winners with rock-solid fundamentals? Check out our Hidden Gem Stocks and add them to your watchlist. These companies are poised for growth regardless of the political or macroeconomic climate.
StockStory is growing and hiring equity analyst and marketing roles. Are you a 0 to 1 builder passionate about the markets and AI? See the open roles here.