The end of the earnings season is always a good time to take a step back and see who shined (and who not so much). Let’s take a look at how traditional fast food stocks fared in Q2, starting with Krispy Kreme (NASDAQ: DNUT).
Traditional fast-food restaurants are renowned for their speed and convenience, boasting menus filled with familiar and budget-friendly items. Their reputations for on-the-go consumption make them favored destinations for individuals and families needing a quick meal. This class of restaurants, however, is fighting the perception that their meals are unhealthy and made with inferior ingredients, a battle that's especially relevant today given the consumers increasing focus on health and wellness.
The 14 traditional fast food stocks we track reported a mixed Q2. As a group, revenues were in line with analysts’ consensus estimates.
In light of this news, share prices of the companies have held steady as they are up 1.6% on average since the latest earnings results.
Krispy Kreme (NASDAQ: DNUT)
Famous for its Original Glazed doughnuts and parent company of Insomnia Cookies, Krispy Kreme (NASDAQ: DNUT) is one of the most beloved and well-known fast-food chains in the world.
Krispy Kreme reported revenues of $379.8 million, down 13.5% year on year. This print exceeded analysts’ expectations by 0.6%. Despite the top-line beat, it was still a softer quarter for the company with a significant miss of analysts’ EBITDA and EPS estimates.
“Looking ahead, we have implemented a comprehensive turnaround plan aimed at unlocking our two biggest opportunities: profitable U.S. expansion and capital-light international franchise growth. This plan is designed to reduce leverage and deliver sustainable, profitable growth through refranchising, improving returns on capital, expanding margins, and driving sustainable, profitable U.S. growth,” said Krispy Kreme CEO Josh Charlesworth.
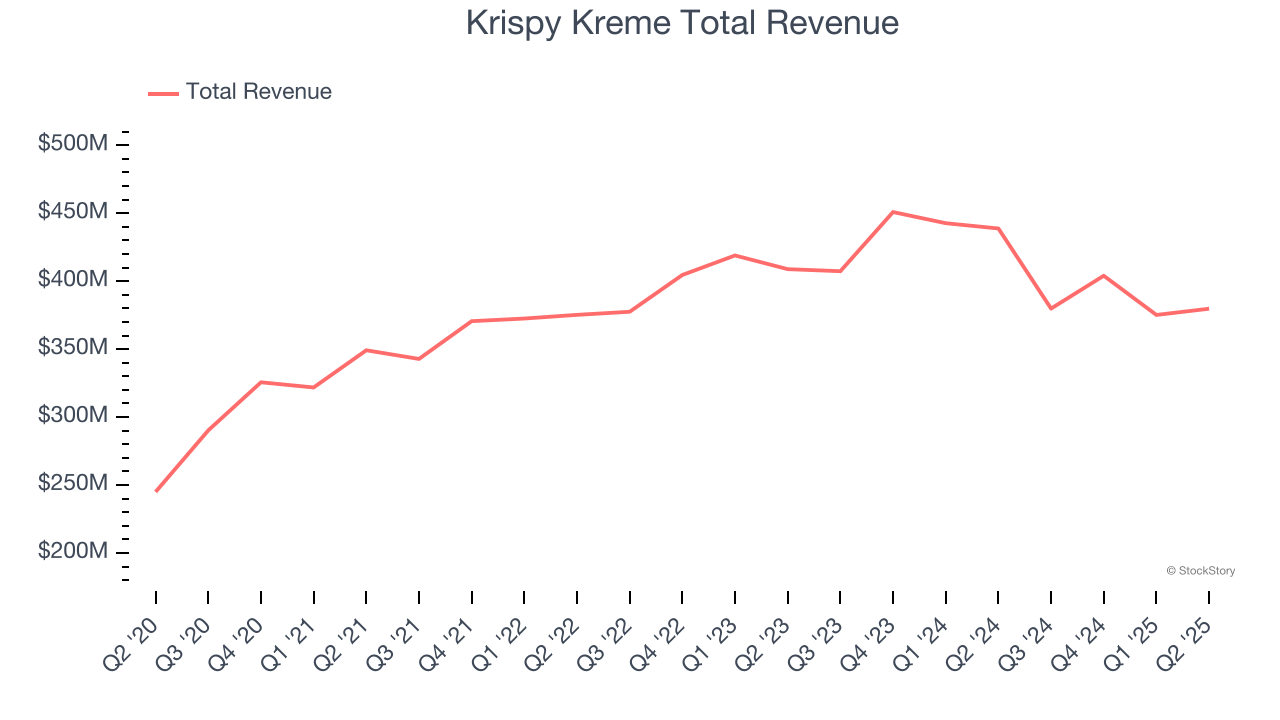
Krispy Kreme delivered the slowest revenue growth of the whole group. Interestingly, the stock is up 4% since reporting and currently trades at $3.55.
Read our full report on Krispy Kreme here, it’s free.
Best Q2: Dutch Bros (NYSE: BROS)
Started in 1992 by two brothers as a single pushcart, Dutch Bros (NYSE: BROS) is a dynamic coffee chain that’s captured the hearts of coffee enthusiasts across the United States.
Dutch Bros reported revenues of $415.8 million, up 28% year on year, outperforming analysts’ expectations by 3.1%. The business had a stunning quarter with an impressive beat of analysts’ EBITDA estimates and an impressive beat of analysts’ same-store sales estimates.
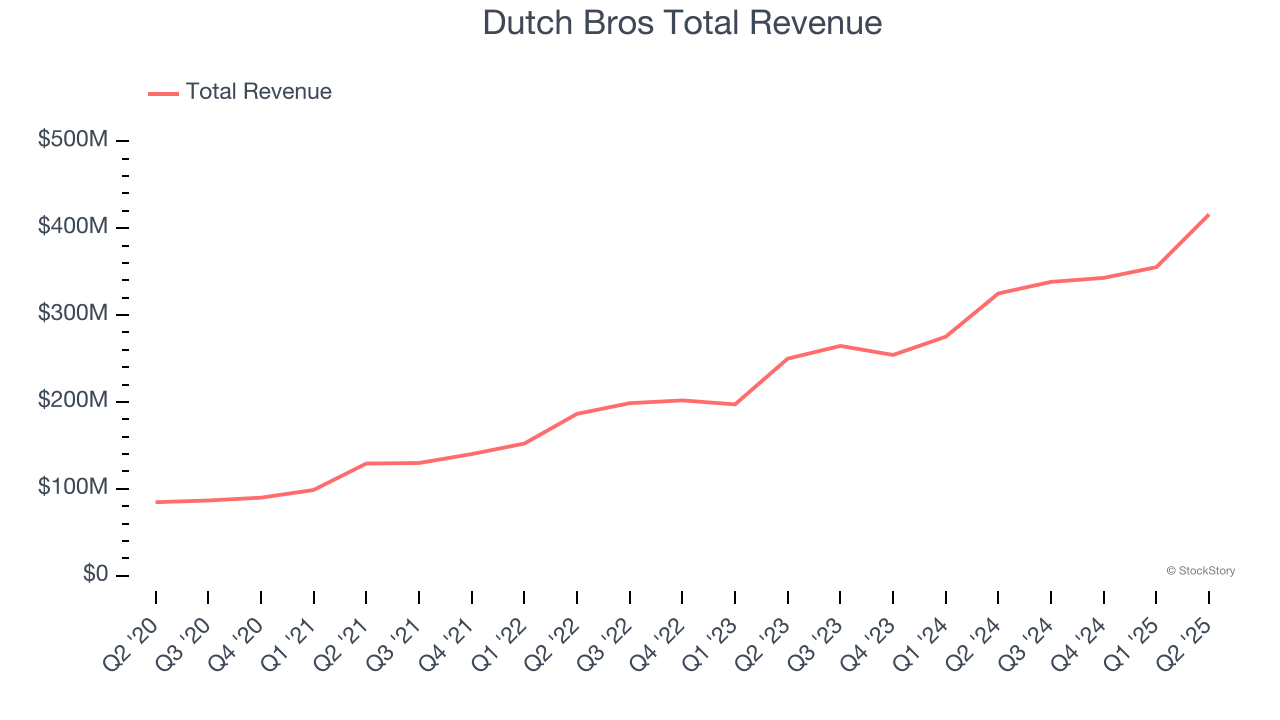
Dutch Bros achieved the biggest analyst estimates beat and fastest revenue growth among its peers. The market seems happy with the results as the stock is up 24.4% since reporting. It currently trades at $71.90.
Is now the time to buy Dutch Bros? Access our full analysis of the earnings results here, it’s free.
Weakest Q2: Jack in the Box (NASDAQ: JACK)
Delighting customers since its inception in 1951, Jack in the Box (NASDAQ: JACK) is a distinctive fast-food chain known for its bold flavors, innovative menu items, and quirky marketing.
Jack in the Box reported revenues of $333 million, down 9.8% year on year, falling short of analysts’ expectations by 2.1%. It was a softer quarter as it posted a miss of analysts’ EBITDA estimates and a miss of analysts’ same-store sales estimates.
The stock is flat since the results and currently trades at $19.11.
Read our full analysis of Jack in the Box’s results here.
Yum China (NYSE: YUMC)
One of China’s largest restaurant companies, Yum China (NYSE: YUMC) is an independent entity spun off from Yum! Brands in 2016.
Yum China reported revenues of $2.79 billion, up 4% year on year. This result missed analysts’ expectations by 0.5%. Aside from that, it was a mixed quarter as it also logged a narrow beat of analysts’ same-store sales estimates but EPS in line with analysts’ estimates.
The stock is down 3.8% since reporting and currently trades at $44.72.
Read our full, actionable report on Yum China here, it’s free.
Portillo's (NASDAQ: PTLO)
Begun as a Chicago hot dog stand in 1963, Portillo’s (NASDAQ: PTLO) is a casual restaurant chain that serves Chicago-style hot dogs and beef sandwiches as well as fries and shakes.
Portillo's reported revenues of $188.5 million, up 3.6% year on year. This print came in 3.9% below analysts' expectations. It was a slower quarter as it also recorded a slight miss of analysts’ same-store sales estimates.
Portillo's had the weakest performance against analyst estimates among its peers. The stock is down 25.4% since reporting and currently trades at $7.09.
Read our full, actionable report on Portillo's here, it’s free.
Market Update
Thanks to the Fed’s rate hikes in 2022 and 2023, inflation has been on a steady path downward, easing back toward that 2% sweet spot. Fortunately (miraculously to some), all this tightening didn’t send the economy tumbling into a recession, so here we are, cautiously celebrating a soft landing. The cherry on top? Recent rate cuts (half a point in September 2024, a quarter in November) have propped up markets, especially after Trump’s November win lit a fire under major indices and sent them to all-time highs. However, there’s still plenty to ponder — tariffs, corporate tax cuts, and what 2025 might hold for the economy.
Want to invest in winners with rock-solid fundamentals? Check out our Top 5 Quality Compounder Stocks and add them to your watchlist. These companies are poised for growth regardless of the political or macroeconomic climate.
StockStory is growing and hiring equity analyst and marketing roles. Are you a 0 to 1 builder passionate about the markets and AI? See the open roles here.