
While the S&P 500 is up 15.6% since March 2025, Travelers (currently trading at $277 per share) has lagged behind, posting a return of 6.8%. This may have investors wondering how to approach the situation.
Find out in our full research report, it’s free.
Why Does Travelers Spark Debate?
Tracing its roots back to 1853 when it insured travelers against accidents on steamboats and railroads, Travelers (NYSE: TRV) provides a wide range of commercial and personal property and casualty insurance products to businesses, government units, associations, and individuals.
Two Things to Like:
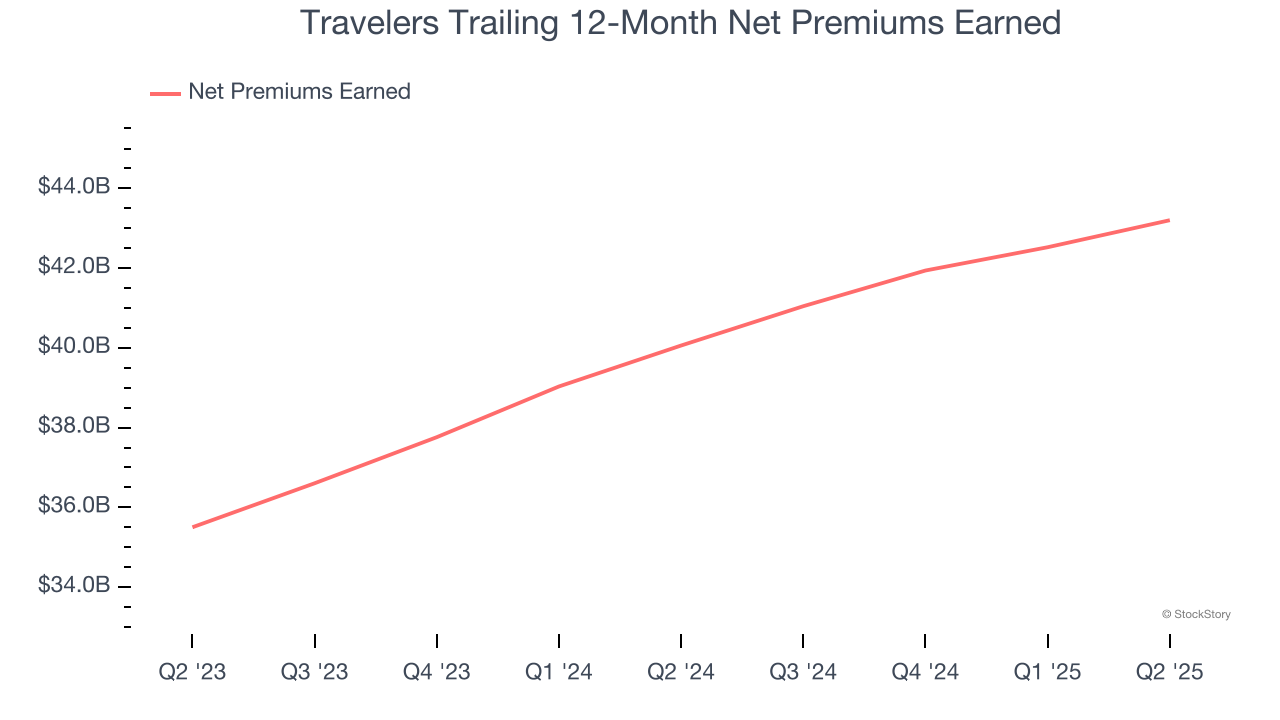
1. Net Premiums Earned Drive Additional Growth Opportunities
When insurers sell policies, they protect themselves from extremely large losses or an outsized accumulation of losses with reinsurance (insurance for insurance companies). Net premiums earned are therefore net of what’s ceded to reinsurers as a risk mitigation and transfer strategy.
Travelers’s net premiums earned has grown at a 10.3% annualized rate over the last two years, a step above the broader insurance industry and in line with its total revenue.
2. Projected BVPS Growth Is Remarkable
An insurer’s book value per share (BVPS) increases when it maintains a profitable combined ratio and effectively manages its investment portfolio.
Over the next 12 months, Consensus estimates call for Travelers’s BVPS to grow by 24.2% to $144.55, elite growth rate.

One Reason to be Careful:
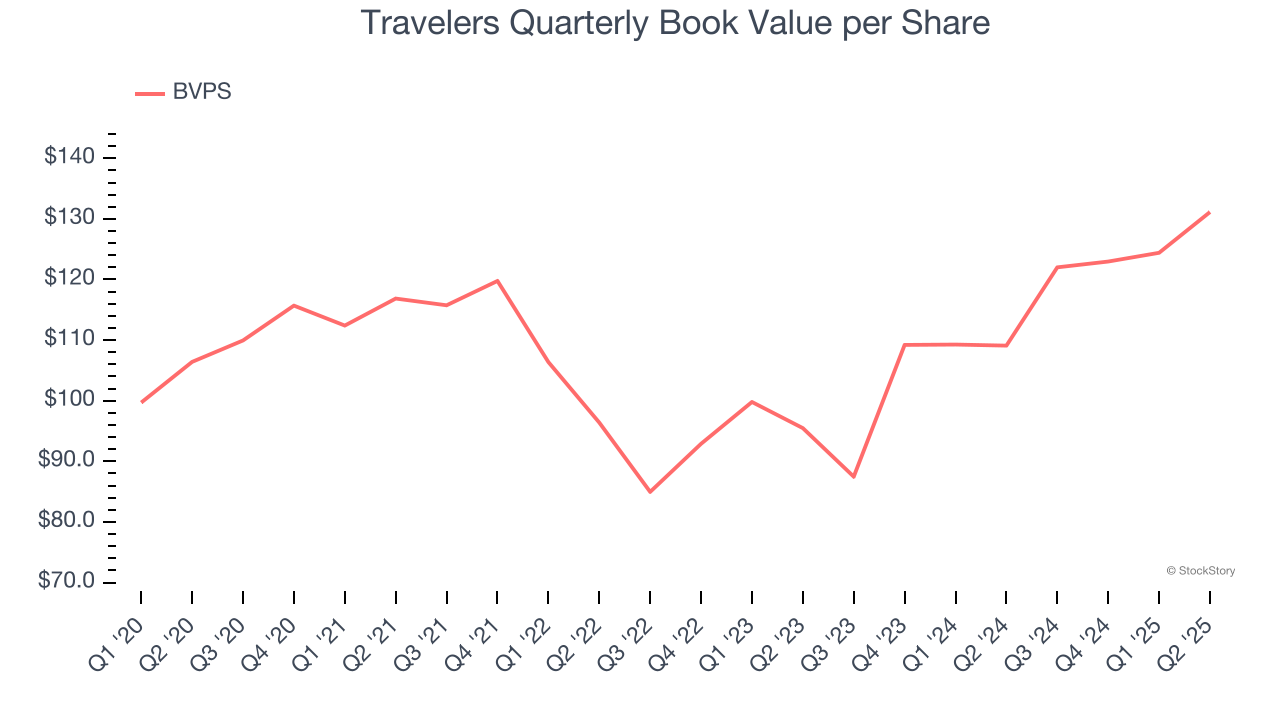
Steady Increase in BVPS Highlights Solid Asset Growth
We consider book value per share (BVPS) a critical metric for insurance companies. BVPS represents the total net worth per share, providing insight into a company’s financial strength and ability to meet policyholder obligations.
Although Travelers’s BVPS increased by a meager 4.3% annually over the last five years, the good news is that its growth has recently accelerated as BVPS grew at a solid 17.2% annual clip over the past two years (from $95.48 to $131.13 per share).
Final Judgment
Travelers’s merits more than compensate for its flaws. With its shares trailing the market in recent months, the stock trades at 2× forward P/B (or $277 per share). Is now the time to initiate a position? See for yourself in our comprehensive research report, it’s free.
High-Quality Stocks for All Market Conditions
When Trump unveiled his aggressive tariff plan in April 2025, markets tanked as investors feared a full-blown trade war. But those who panicked and sold missed the subsequent rebound that’s already erased most losses.
Don’t let fear keep you from great opportunities and take a look at Top 6 Stocks for this week. This is a curated list of our High Quality stocks that have generated a market-beating return of 183% over the last five years (as of March 31st 2025).
Stocks that made our list in 2020 include now familiar names such as Nvidia (+1,545% between March 2020 and March 2025) as well as under-the-radar businesses like the once-micro-cap company Tecnoglass (+1,754% five-year return). Find your next big winner with StockStory today.
StockStory is growing and hiring equity analyst and marketing roles. Are you a 0 to 1 builder passionate about the markets and AI? See the open roles here.