Northrop Grumman trades at $573 per share and has stayed right on track with the overall market, gaining 15.7% over the last six months. At the same time, the S&P 500 has returned 15.6%.
Is now the time to buy Northrop Grumman, or should you be careful about including it in your portfolio? Get the full breakdown from our expert analysts, it’s free.
Why Do We Think Northrop Grumman Will Underperform?
We don't have much confidence in Northrop Grumman. Here are three reasons why NOC doesn't excite us and a stock we'd rather own.
1. Slow Organic Growth Suggests Waning Demand In Core Business
Investors interested in Defense Contractors companies should track organic revenue in addition to reported revenue. This metric gives visibility into Northrop Grumman’s core business because it excludes one-time events such as mergers, acquisitions, and divestitures along with foreign currency fluctuations - non-fundamental factors that can manipulate the income statement.
Over the last two years, Northrop Grumman’s organic revenue averaged 3.5% year-on-year growth. This performance was underwhelming and suggests it may need to improve its products, pricing, or go-to-market strategy, which can add an extra layer of complexity to its operations. 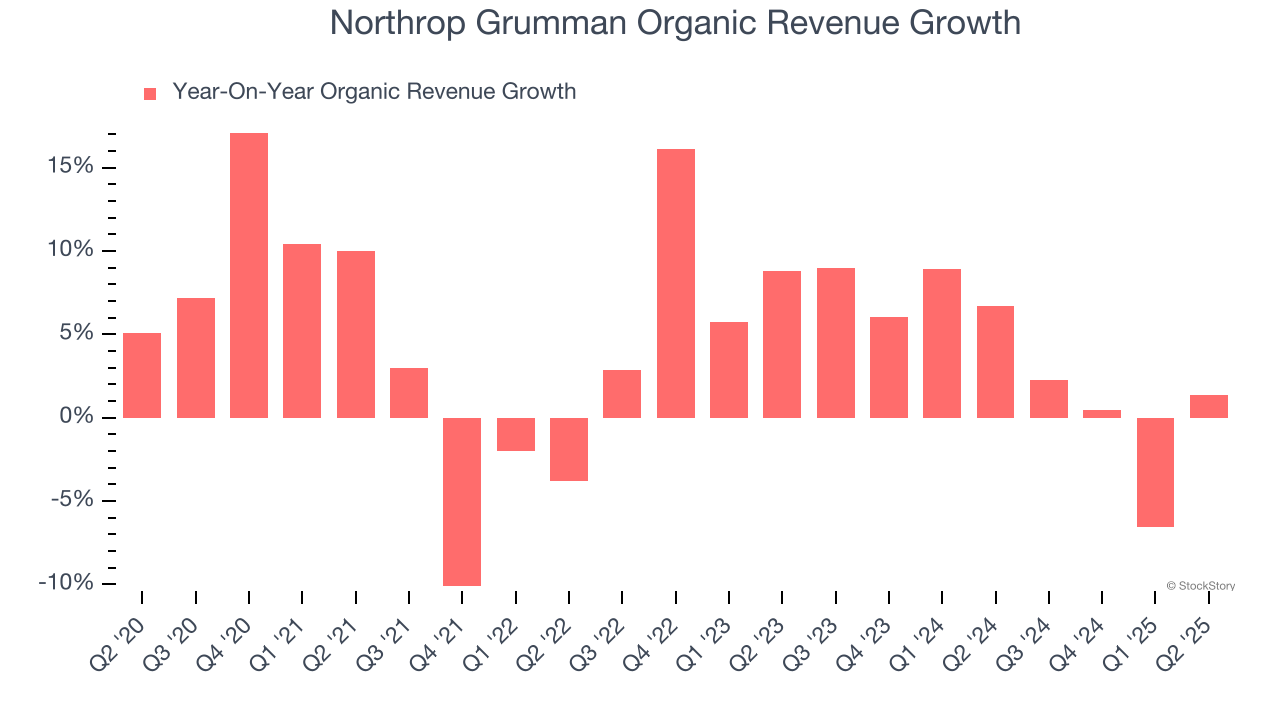
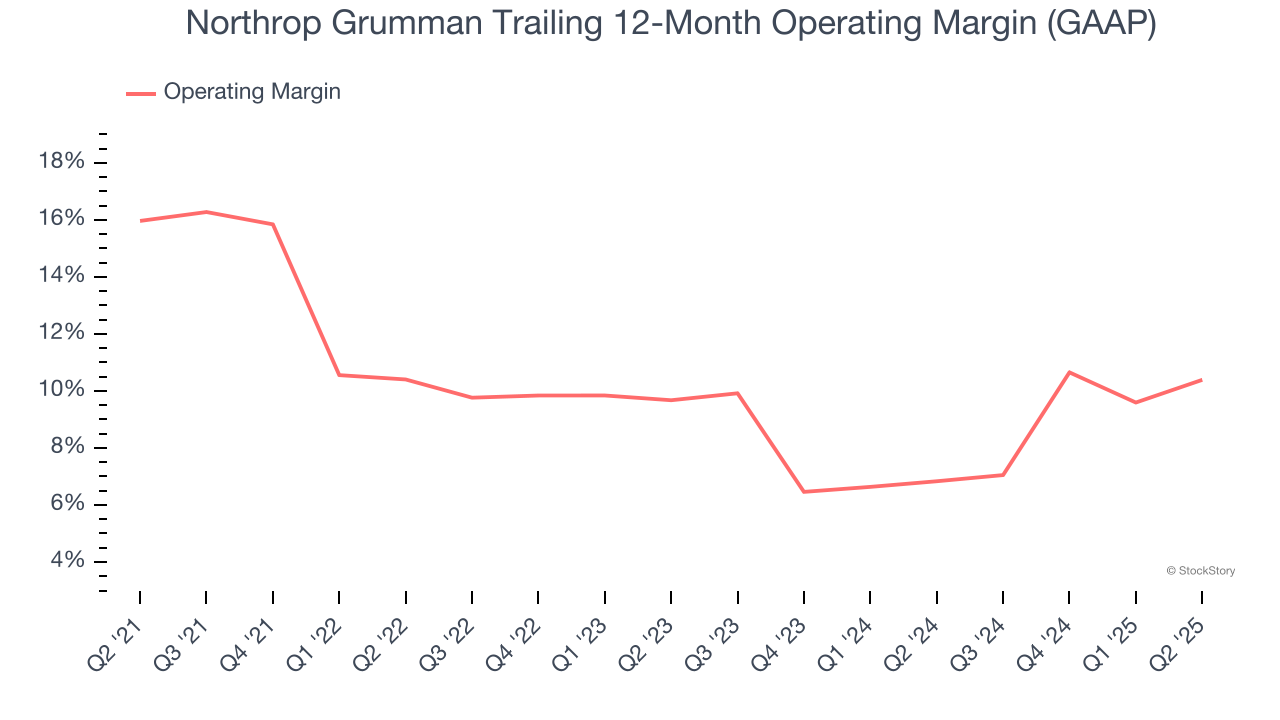
2. Shrinking Operating Margin
Operating margin is an important measure of profitability as it shows the portion of revenue left after accounting for all core expenses – everything from the cost of goods sold to advertising and wages. It’s also useful for comparing profitability across companies with different levels of debt and tax rates because it excludes interest and taxes.
Analyzing the trend in its profitability, Northrop Grumman’s operating margin decreased by 5.6 percentage points over the last five years. This raises questions about the company’s expense base because its revenue growth should have given it leverage on its fixed costs, resulting in better economies of scale and profitability. Its operating margin for the trailing 12 months was 10.4%.
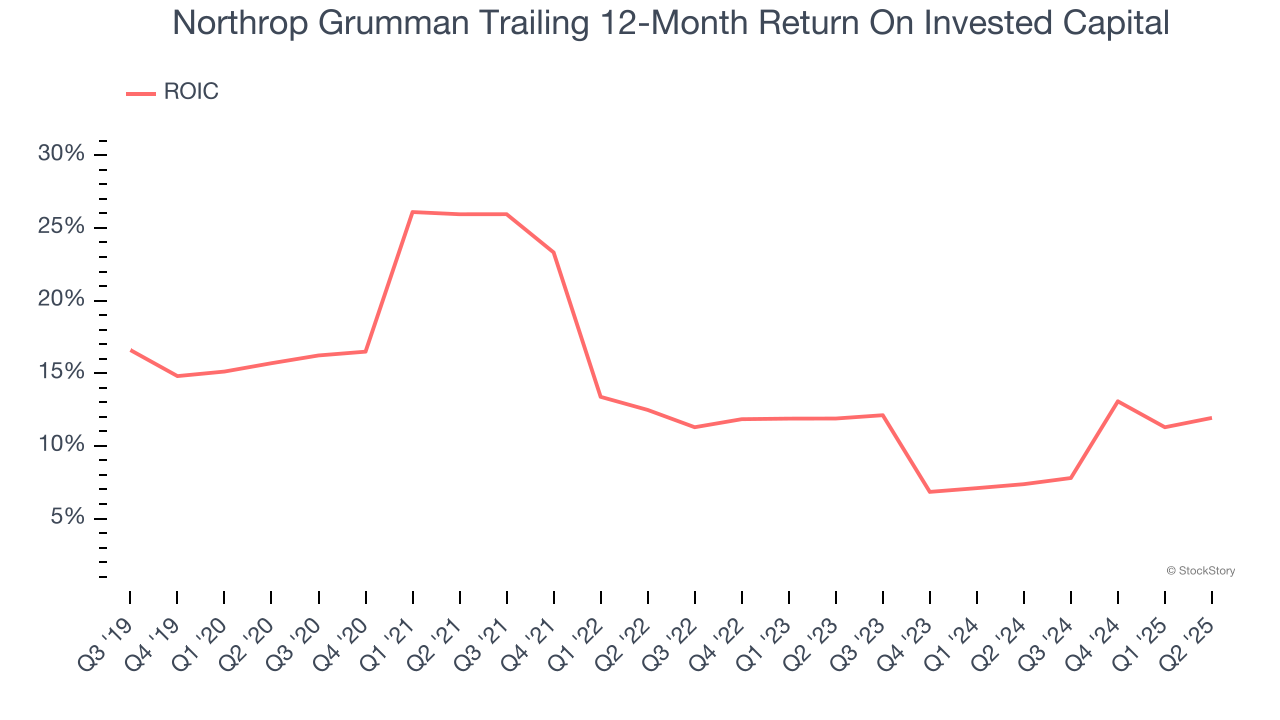
3. New Investments Fail to Bear Fruit as ROIC Declines
A company’s ROIC, or return on invested capital, shows how much operating profit it makes compared to the money it has raised (debt and equity).
We like to invest in businesses with high returns, but the trend in a company’s ROIC is what often surprises the market and moves the stock price. Unfortunately, Northrop Grumman’s ROIC has decreased over the last few years. We like what management has done in the past, but its declining returns are perhaps a symptom of fewer profitable growth opportunities.
Final Judgment
We see the value of companies helping their customers, but in the case of Northrop Grumman, we’re out. That said, the stock currently trades at 20.2× forward P/E (or $573 per share). This valuation tells us it’s a bit of a market darling with a lot of good news priced in - you can find more timely opportunities elsewhere. Let us point you toward one of our top digital advertising picks.
Stocks We Would Buy Instead of Northrop Grumman
When Trump unveiled his aggressive tariff plan in April 2025, markets tanked as investors feared a full-blown trade war. But those who panicked and sold missed the subsequent rebound that’s already erased most losses.
Don’t let fear keep you from great opportunities and take a look at Top 6 Stocks for this week. This is a curated list of our High Quality stocks that have generated a market-beating return of 183% over the last five years (as of March 31st 2025).
Stocks that made our list in 2020 include now familiar names such as Nvidia (+1,545% between March 2020 and March 2025) as well as under-the-radar businesses like the once-small-cap company Comfort Systems (+782% five-year return). Find your next big winner with StockStory today.
StockStory is growing and hiring equity analyst and marketing roles. Are you a 0 to 1 builder passionate about the markets and AI? See the open roles here.