Clean Harbors has followed the market’s trajectory closely, rising in tandem with the S&P 500 over the past six months. The stock has climbed by 18.3% to $236.99 per share while the index has gained 16.2%.
Is there a buying opportunity in Clean Harbors, or does it present a risk to your portfolio? Check out our in-depth research report to see what our analysts have to say, it’s free.
Why Is Clean Harbors Not Exciting?
We're swiping left on Clean Harbors for now. Here are three reasons we avoid CLH and a stock we'd rather own.
1. Slow Organic Growth Suggests Waning Demand In Core Business
In addition to reported revenue, organic revenue is a useful data point for analyzing Waste Management companies. This metric gives visibility into Clean Harbors’s core business because it excludes one-time events such as mergers, acquisitions, and divestitures along with foreign currency fluctuations - non-fundamental factors that can manipulate the income statement.
Over the last two years, Clean Harbors’s organic revenue averaged 2.5% year-on-year growth. This performance was underwhelming and suggests it may need to improve its products, pricing, or go-to-market strategy, which can add an extra layer of complexity to its operations. 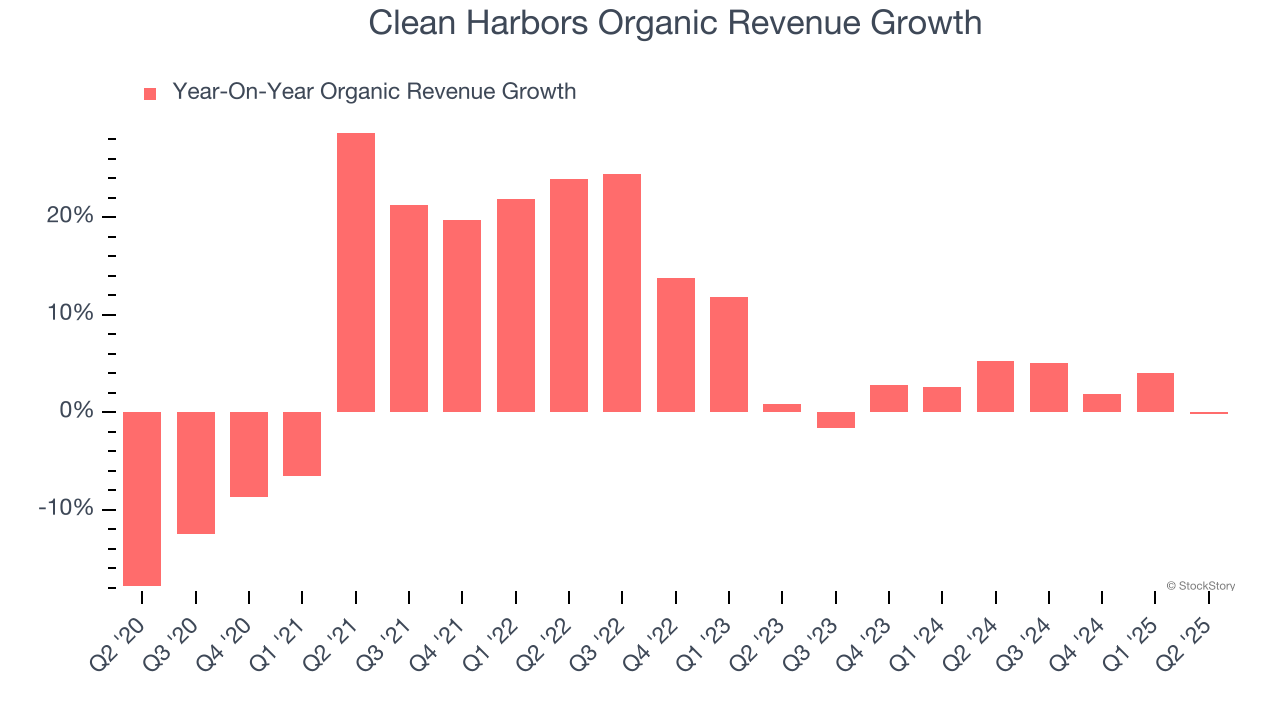
2. EPS Took a Dip Over the Last Two Years
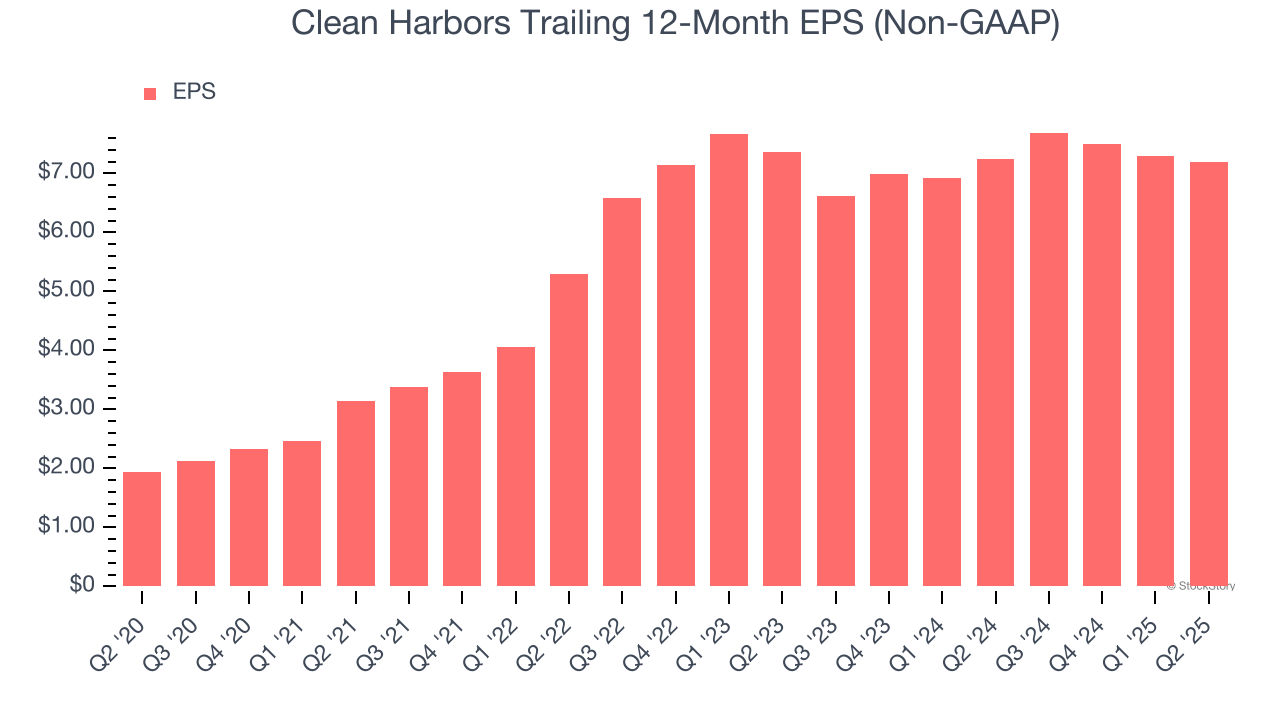
Although long-term earnings trends give us the big picture, we like to analyze EPS over a shorter period to see if we are missing a change in the business.
Sadly for Clean Harbors, its EPS declined by 1.2% annually over the last two years while its revenue grew by 5.4%. This tells us the company became less profitable on a per-share basis as it expanded.
3. Free Cash Flow Margin Dropping
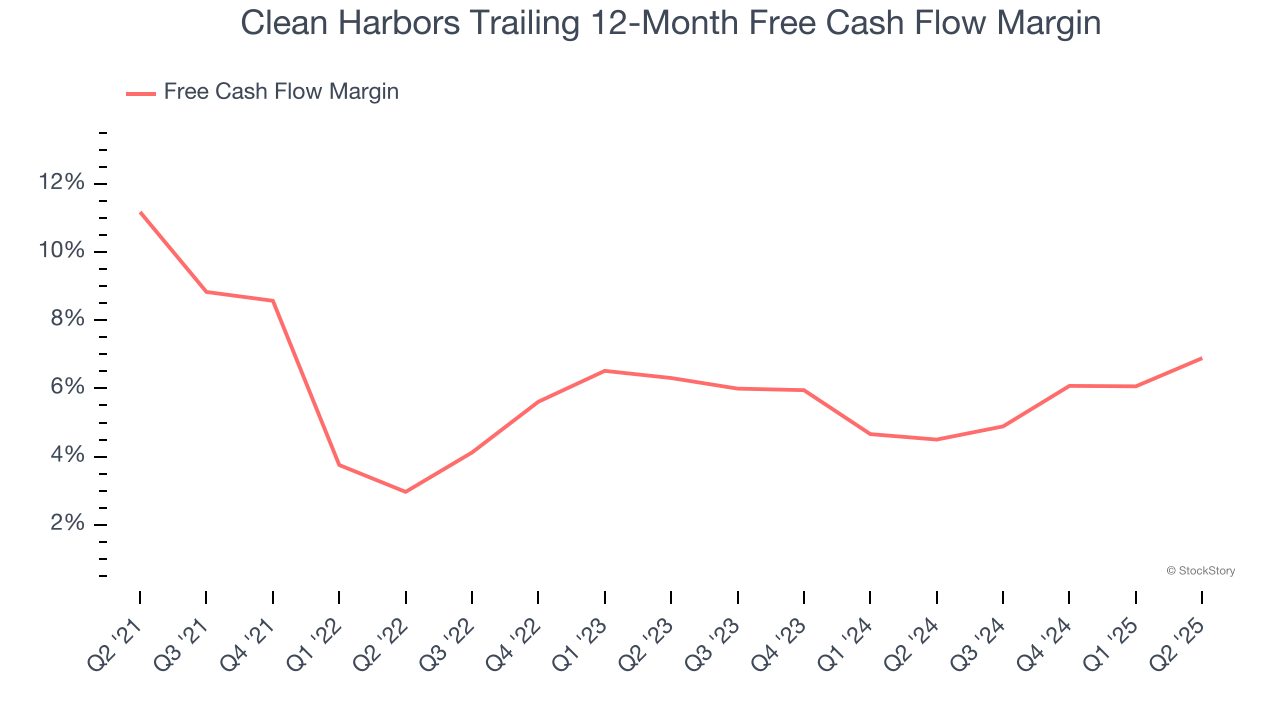
If you’ve followed StockStory for a while, you know we emphasize free cash flow. Why, you ask? We believe that in the end, cash is king, and you can’t use accounting profits to pay the bills.
As you can see below, Clean Harbors’s margin dropped by 4.3 percentage points over the last five years. It may have ticked higher more recently, but shareholders are likely hoping for its margin to at least revert to its historical level. If the longer-term trend returns, it could signal increasing investment needs and capital intensity. Clean Harbors’s free cash flow margin for the trailing 12 months was 6.9%.
Final Judgment
Clean Harbors’s business quality ultimately falls short of our standards. That said, the stock currently trades at 28.1× forward P/E (or $236.99 per share). While this valuation is reasonable, we don’t really see a big opportunity at the moment. We're pretty confident there are more exciting stocks to buy at the moment. We’d recommend looking at a safe-and-steady industrials business benefiting from an upgrade cycle.
Stocks We Would Buy Instead of Clean Harbors
When Trump unveiled his aggressive tariff plan in April 2025, markets tanked as investors feared a full-blown trade war. But those who panicked and sold missed the subsequent rebound that’s already erased most losses.
Don’t let fear keep you from great opportunities and take a look at Top 9 Market-Beating Stocks. This is a curated list of our High Quality stocks that have generated a market-beating return of 183% over the last five years (as of March 31st 2025).
Stocks that made our list in 2020 include now familiar names such as Nvidia (+1,545% between March 2020 and March 2025) as well as under-the-radar businesses like the once-micro-cap company Tecnoglass (+1,754% five-year return). Find your next big winner with StockStory today.
StockStory is growing and hiring equity analyst and marketing roles. Are you a 0 to 1 builder passionate about the markets and AI? See the open roles here.