
Vulcan Materials has had an impressive run over the past six months as its shares have beaten the S&P 500 by 8%. The stock now trades at $299, marking a 24.2% gain. This run-up might have investors contemplating their next move.
Is there a buying opportunity in Vulcan Materials, or does it present a risk to your portfolio? Check out our in-depth research report to see what our analysts have to say, it’s free.
Why Is Vulcan Materials Not Exciting?
We’re glad investors have benefited from the price increase, but we're sitting this one out for now. Here are three reasons we avoid VMC and a stock we'd rather own.
1. Revenue Growth Flatlining
Long-term growth is the most important, but within industrials, a stretched historical view may miss new industry trends or demand cycles. Vulcan Materials’s recent performance shows its demand has slowed as its revenue was flat over the last two years. 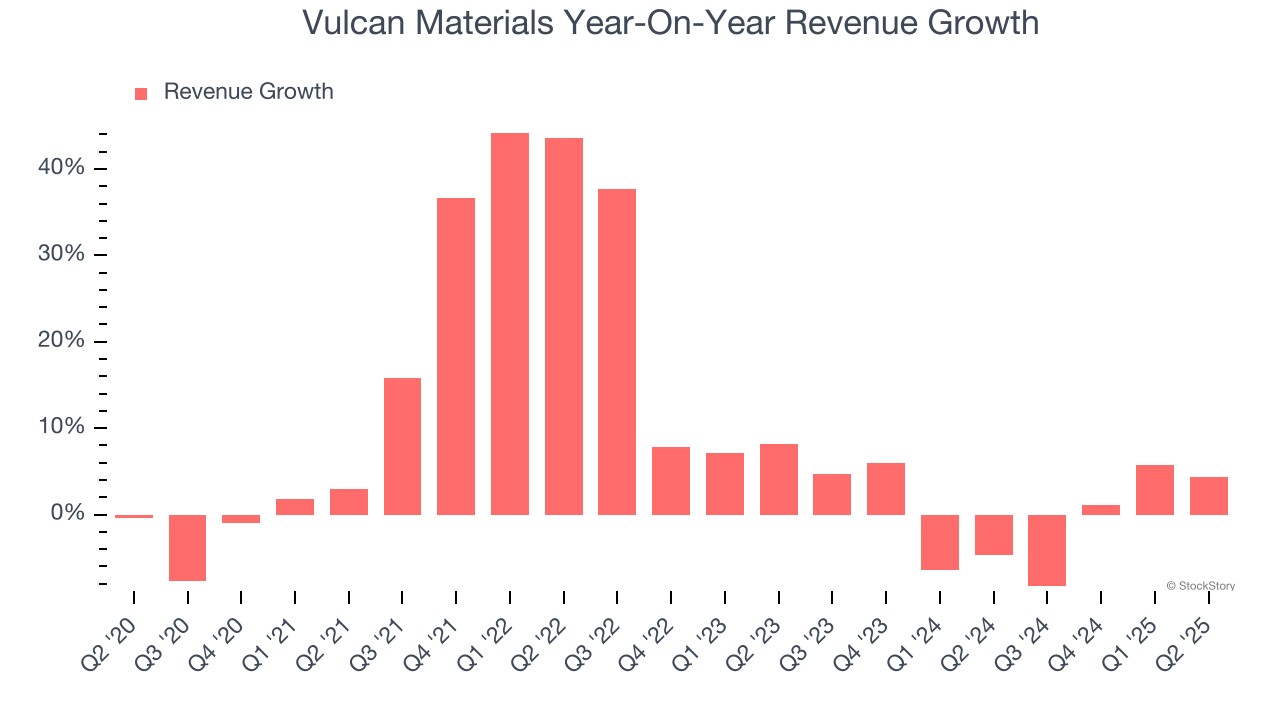
2. Decline in Tons Shipped Points to Weak Demand
Revenue growth can be broken down into changes in price and volume (for companies like Vulcan Materials, our preferred volume metric is tons shipped). While both are important, the latter is the most critical to analyze because prices have a ceiling.
Vulcan Materials’s tons shipped came in at 59.3 million in the latest quarter, and over the last two years, averaged 3.3% year-on-year declines. This performance was underwhelming and implies there may be increasing competition or market saturation. It also suggests Vulcan Materials might have to lower prices or invest in product improvements to grow, factors that can hinder near-term profitability. 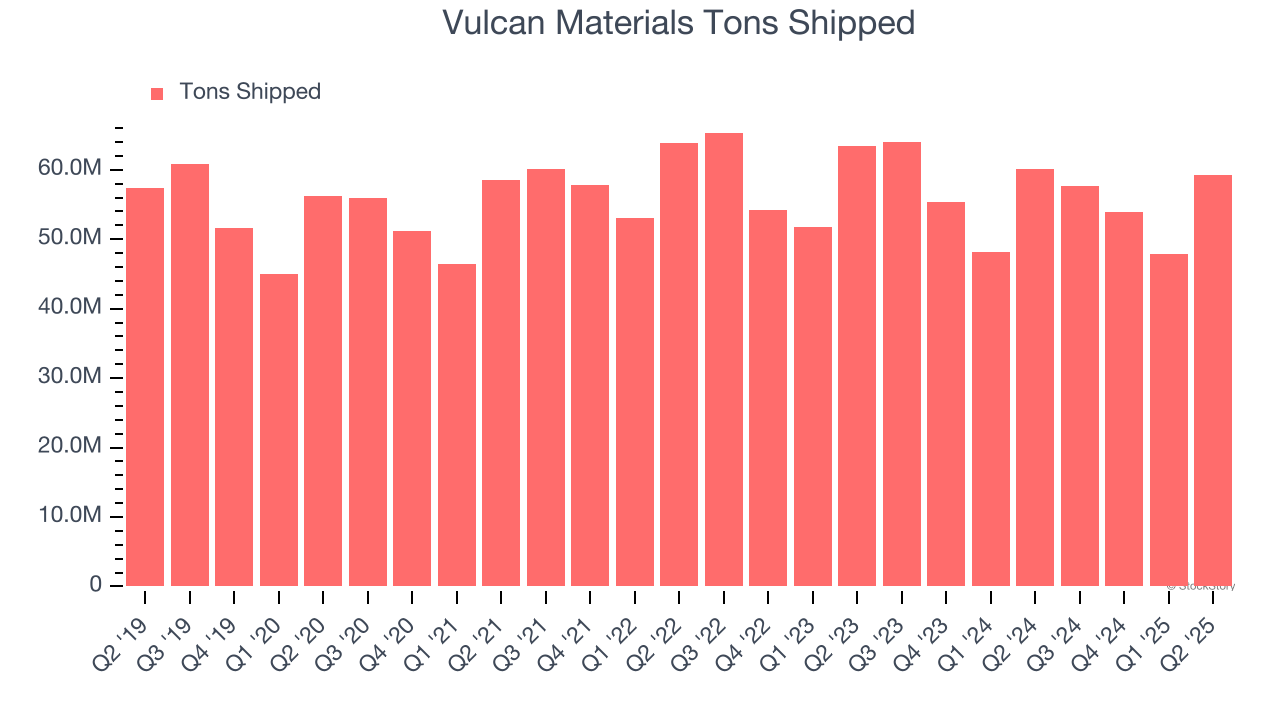
3. Low Gross Margin Reveals Weak Structural Profitability
At StockStory, we prefer high gross margin businesses because they indicate the company has pricing power or differentiated products, giving it a chance to generate higher operating profits.
Vulcan Materials has bad unit economics for an industrials company, giving it less room to reinvest and develop new offerings. As you can see below, it averaged a 25% gross margin over the last five years. Said differently, Vulcan Materials had to pay a chunky $75.02 to its suppliers for every $100 in revenue. 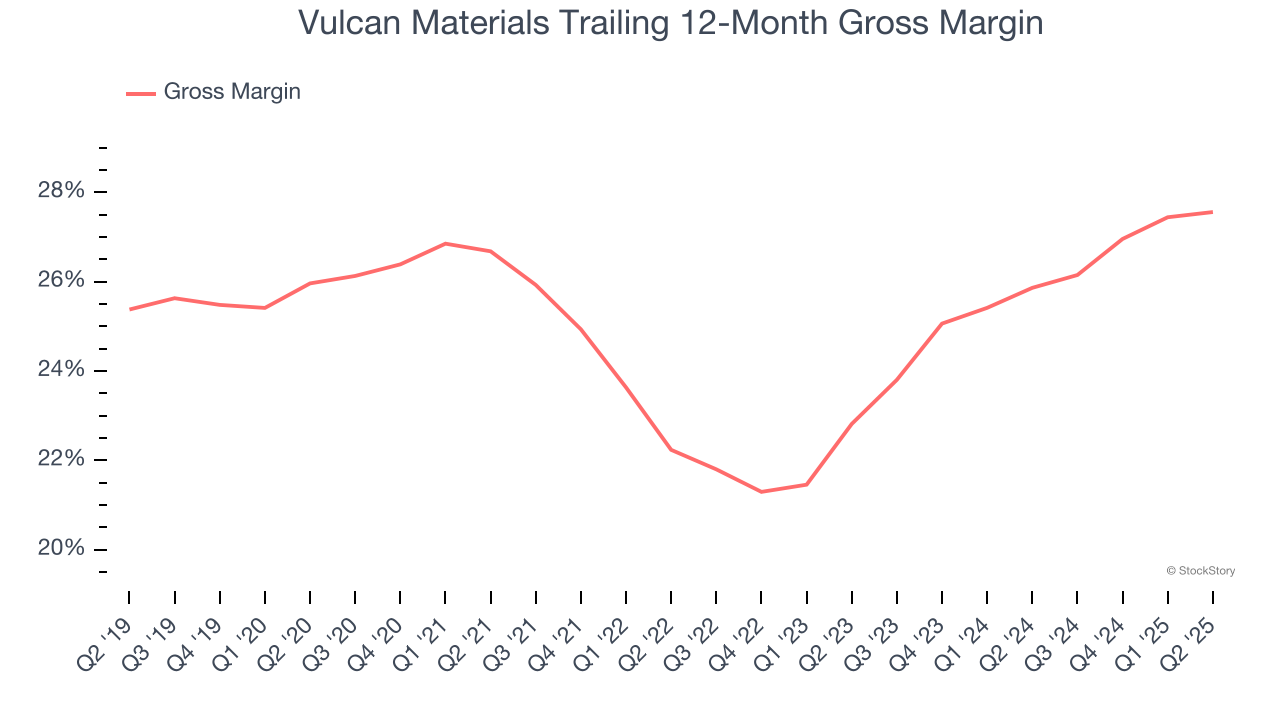
Final Judgment
Vulcan Materials isn’t a terrible business, but it doesn’t pass our quality test. With its shares topping the market in recent months, the stock trades at 33.6× forward P/E (or $299 per share). Beauty is in the eye of the beholder, but our analysis shows the upside isn’t great compared to the potential downside. We're pretty confident there are superior stocks to buy right now. We’d recommend looking at a top digital advertising platform riding the creator economy.
Stocks We Like More Than Vulcan Materials
Trump’s April 2025 tariff bombshell triggered a massive market selloff, but stocks have since staged an impressive recovery, leaving those who panic sold on the sidelines.
Take advantage of the rebound by checking out our Top 5 Strong Momentum Stocks for this week. This is a curated list of our High Quality stocks that have generated a market-beating return of 183% over the last five years (as of March 31st 2025).
Stocks that made our list in 2020 include now familiar names such as Nvidia (+1,545% between March 2020 and March 2025) as well as under-the-radar businesses like the once-micro-cap company Kadant (+351% five-year return). Find your next big winner with StockStory today.
StockStory is growing and hiring equity analyst and marketing roles. Are you a 0 to 1 builder passionate about the markets and AI? See the open roles here.