Hillman has been treading water for the past six months, holding steady at $9.06. The stock also fell short of the S&P 500’s 15.7% gain during that period.
Is there a buying opportunity in Hillman, or does it present a risk to your portfolio? Get the full stock story straight from our expert analysts, it’s free.
Why Is Hillman Not Exciting?
We're cautious about Hillman. Here are three reasons why HLMN doesn't excite us and a stock we'd rather own.
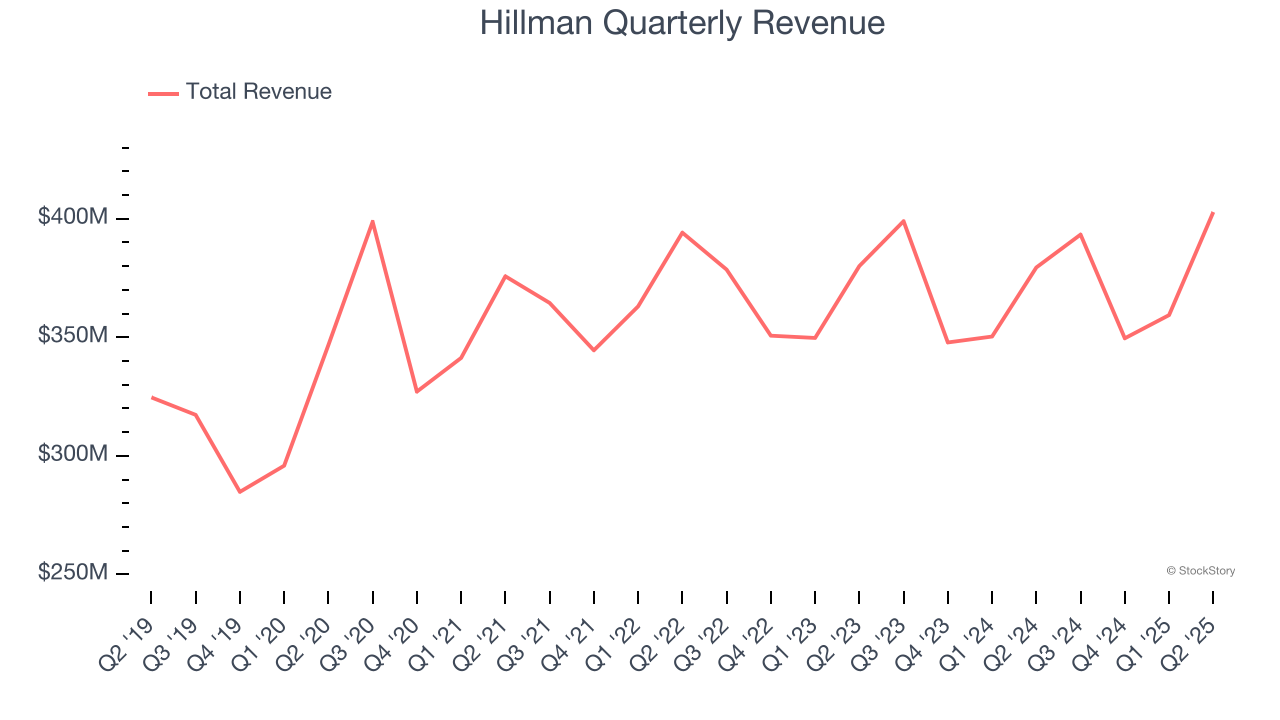
1. Long-Term Revenue Growth Disappoints
A company’s long-term sales performance is one signal of its overall quality. Any business can have short-term success, but a top-tier one grows for years. Regrettably, Hillman’s sales grew at a sluggish 3.9% compounded annual growth rate over the last five years. This was below our standard for the industrials sector.
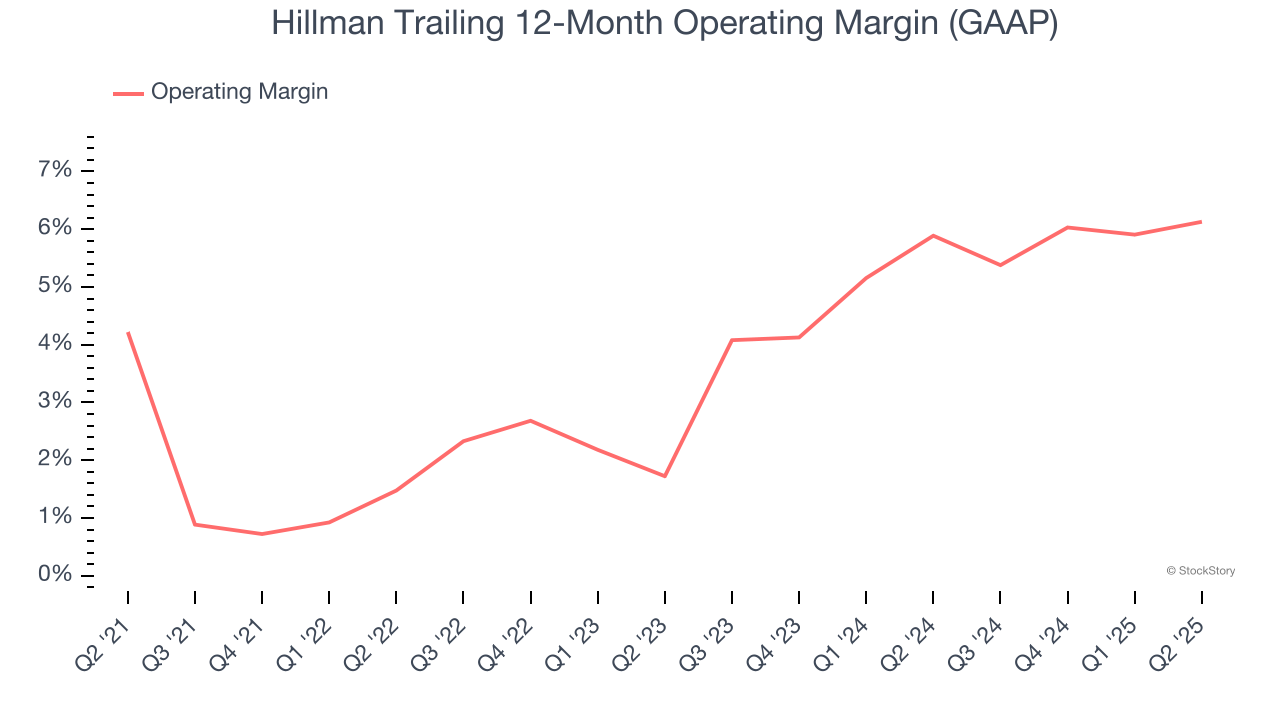
2. Weak Operating Margin Could Cause Trouble
Operating margin is one of the best measures of profitability because it tells us how much money a company takes home after procuring and manufacturing its products, marketing and selling those products, and most importantly, keeping them relevant through research and development.
Hillman was profitable over the last five years but held back by its large cost base. Its average operating margin of 3.9% was weak for an industrials business. This result is surprising given its high gross margin as a starting point.
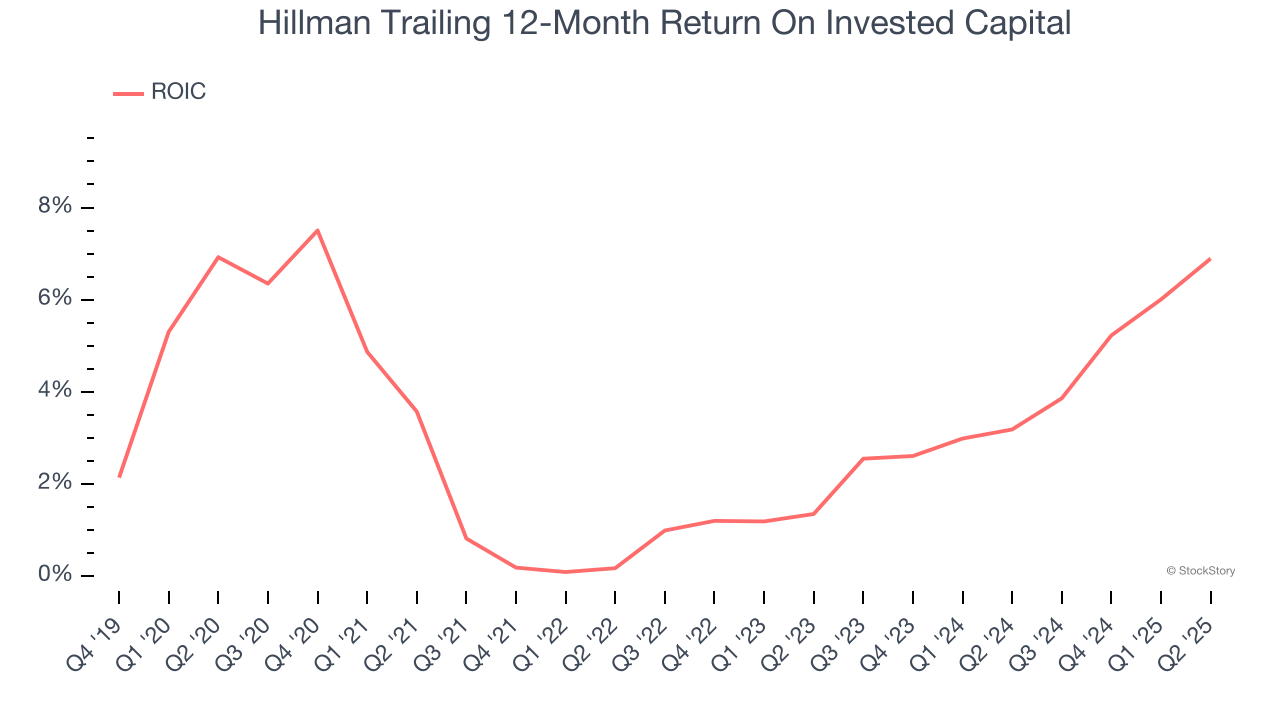
3. Previous Growth Initiatives Haven’t Impressed
Growth gives us insight into a company’s long-term potential, but how capital-efficient was that growth? Enter ROIC, a metric showing how much operating profit a company generates relative to the money it has raised (debt and equity).
Hillman historically did a mediocre job investing in profitable growth initiatives. Its five-year average ROIC was 3%, lower than the typical cost of capital (how much it costs to raise money) for industrials companies.
Final Judgment
Hillman isn’t a terrible business, but it doesn’t pass our quality test. With its shares trailing the market in recent months, the stock trades at 16.5× forward P/E (or $9.06 per share). This valuation multiple is fair, but we don’t have much faith in the company. We're pretty confident there are superior stocks to buy right now. We’d recommend looking at a safe-and-steady industrials business benefiting from an upgrade cycle.
Stocks We Would Buy Instead of Hillman
Trump’s April 2025 tariff bombshell triggered a massive market selloff, but stocks have since staged an impressive recovery, leaving those who panic sold on the sidelines.
Take advantage of the rebound by checking out our Top 5 Strong Momentum Stocks for this week. This is a curated list of our High Quality stocks that have generated a market-beating return of 183% over the last five years (as of March 31st 2025).
Stocks that made our list in 2020 include now familiar names such as Nvidia (+1,545% between March 2020 and March 2025) as well as under-the-radar businesses like the once-micro-cap company Kadant (+351% five-year return). Find your next big winner with StockStory today.
StockStory is growing and hiring equity analyst and marketing roles. Are you a 0 to 1 builder passionate about the markets and AI? See the open roles here.