
Zevia has had an impressive run over the past six months as its shares have beaten the S&P 500 by 11.2%. The stock now trades at $2.64, marking a 26.9% gain. This was partly thanks to its solid quarterly results, and the run-up might have investors contemplating their next move.
Is now the time to buy Zevia, or should you be careful about including it in your portfolio? Check out our in-depth research report to see what our analysts have to say, it’s free.
Why Is Zevia Not Exciting?
We’re glad investors have benefited from the price increase, but we're cautious about Zevia. Here are three reasons why ZVIA doesn't excite us and a stock we'd rather own.
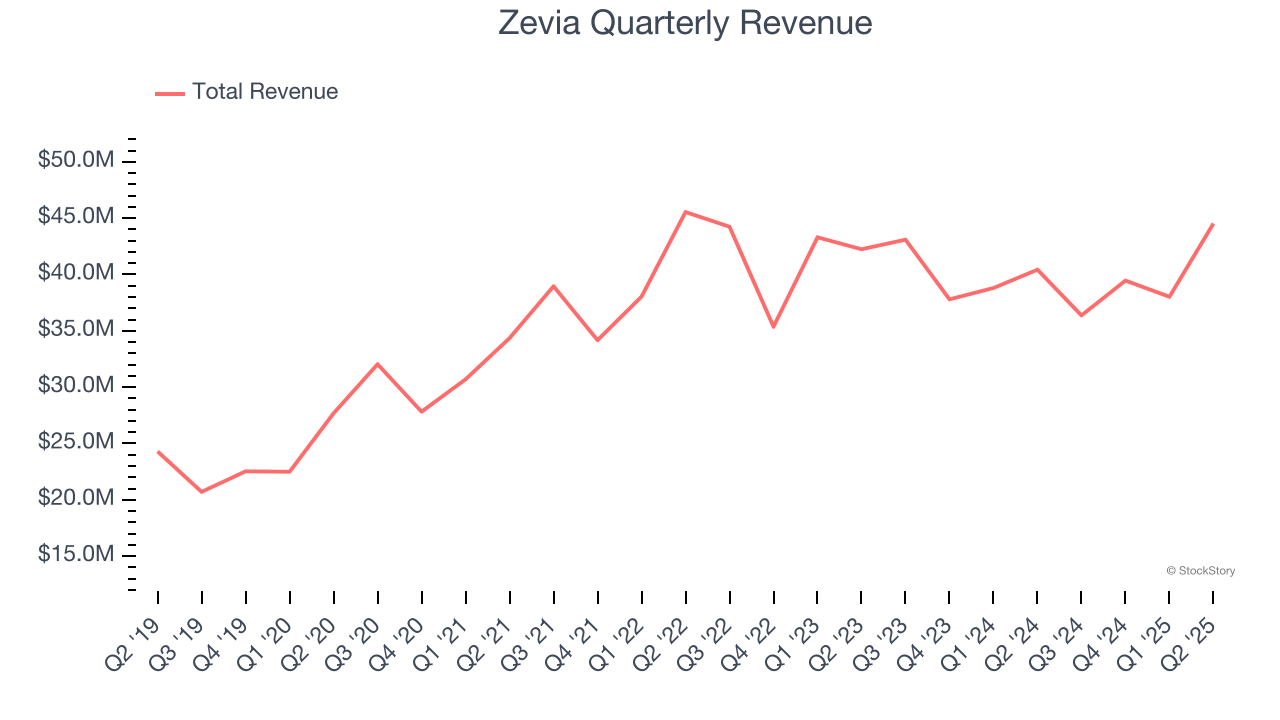
1. Long-Term Revenue Growth Flatter Than a Pancake
Reviewing a company’s long-term sales performance reveals insights into its quality. Any business can have short-term success, but a top-tier one grows for years. Unfortunately, Zevia struggled to consistently increase demand as its $158.4 million of sales for the trailing 12 months was close to its revenue three years ago. This wasn’t a great result and is a sign of lacking business quality.
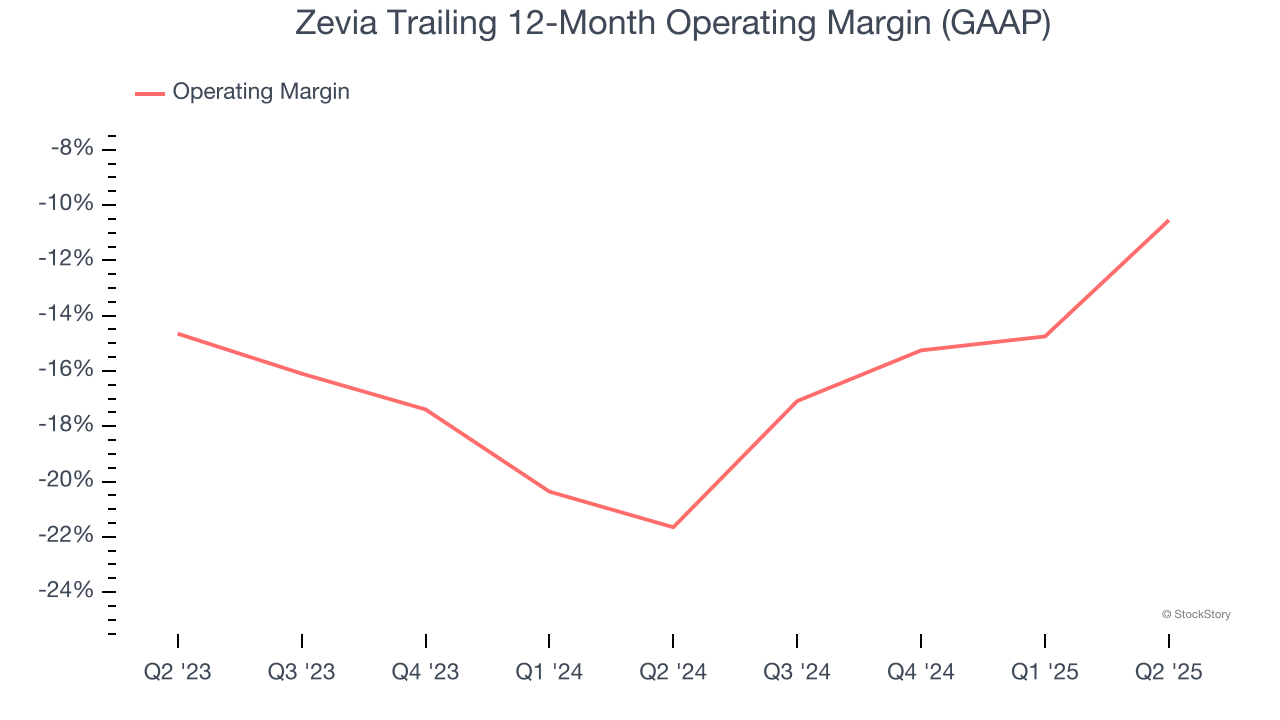
2. Operating Losses Sound the Alarms
Operating margin is a key profitability metric because it accounts for all expenses enabling a business to operate smoothly, including marketing and advertising, IT systems, wages, and other administrative costs.
Unprofitable public companies are rare in the defensive consumer staples industry. Unfortunately, Zevia was one of them over the last two years as its high expenses contributed to an average operating margin of negative 16.1%.
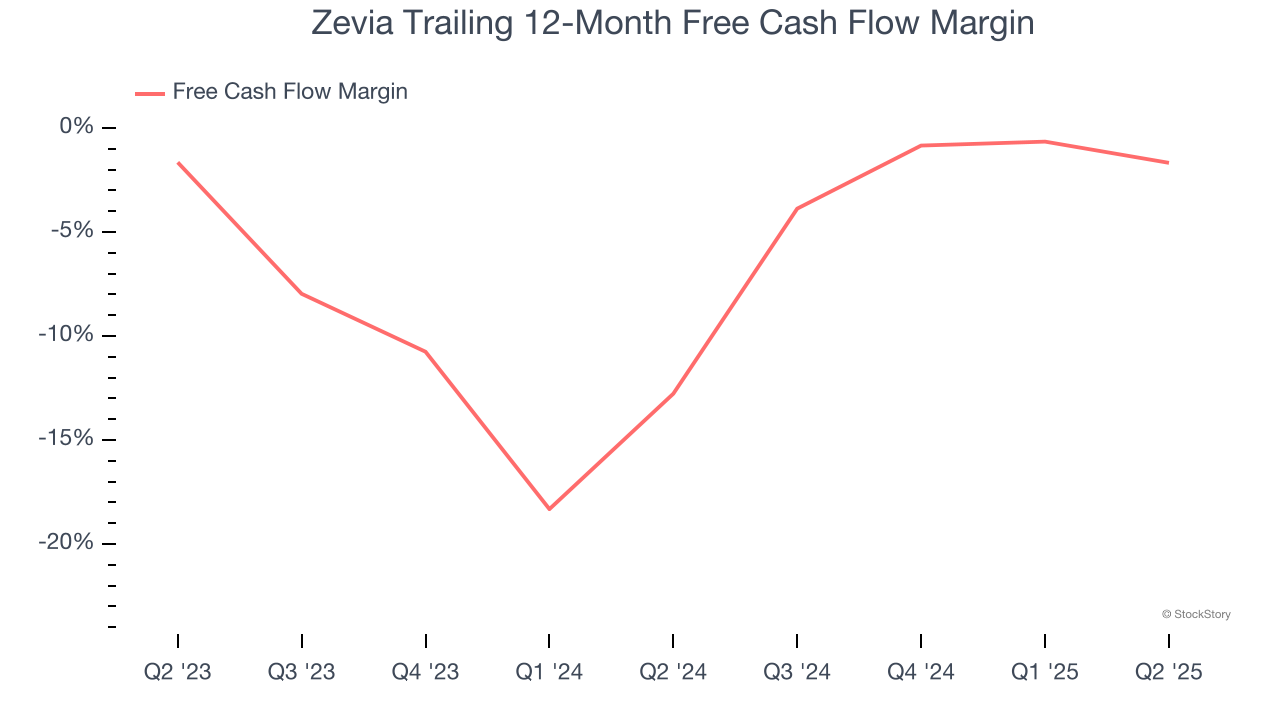
3. Cash Burn Ignites Concerns
Free cash flow isn't a prominently featured metric in company financials and earnings releases, but we think it's telling because it accounts for all operating and capital expenses, making it tough to manipulate. Cash is king.
Zevia’s demanding reinvestments have drained its resources over the last two years, putting it in a pinch and limiting its ability to return capital to investors. Its free cash flow margin averaged negative 7.3%, meaning it lit $7.25 of cash on fire for every $100 in revenue.
Final Judgment
Zevia isn’t a terrible business, but it doesn’t pass our quality test. With its shares beating the market recently, the stock trades at $2.64 per share (or a forward price-to-sales ratio of 1×). The market typically values companies like Zevia based on their anticipated profits for the next 12 months, but it expects the business to lose money. We also think the upside isn’t great compared to the potential downside here - there are more exciting stocks to buy. We’d recommend looking at one of our top software and edge computing picks.
High-Quality Stocks for All Market Conditions
Trump’s April 2025 tariff bombshell triggered a massive market selloff, but stocks have since staged an impressive recovery, leaving those who panic sold on the sidelines.
Take advantage of the rebound by checking out our Top 6 Stocks for this week. This is a curated list of our High Quality stocks that have generated a market-beating return of 183% over the last five years (as of March 31st 2025).
Stocks that made our list in 2020 include now familiar names such as Nvidia (+1,545% between March 2020 and March 2025) as well as under-the-radar businesses like the once-micro-cap company Tecnoglass (+1,754% five-year return). Find your next big winner with StockStory today.
StockStory is growing and hiring equity analyst and marketing roles. Are you a 0 to 1 builder passionate about the markets and AI? See the open roles here.


