
eXp World currently trades at $10.77 per share and has shown little upside over the past six months, posting a middling return of 4.9%. The stock also fell short of the S&P 500’s 15.7% gain during that period.
Is now the time to buy eXp World, or should you be careful about including it in your portfolio? Dive into our full research report to see our analyst team’s opinion, it’s free.
Why Do We Think eXp World Will Underperform?
We're sitting this one out for now. Here are three reasons you should be careful with EXPI and a stock we'd rather own.
1. Decline in Agents and Brokers Points to Weak Demand
Revenue growth can be broken down into changes in price and volume (for companies like eXp World, our preferred volume metric is agents and brokers). While both are important, the latter is the most critical to analyze because prices have a ceiling.
eXp World’s agents and brokers came in at 82,704 in the latest quarter, and over the last two years, averaged 2% year-on-year declines. This performance was underwhelming and implies there may be increasing competition or market saturation. It also suggests eXp World might have to lower prices or invest in product improvements to grow, factors that can hinder near-term profitability. 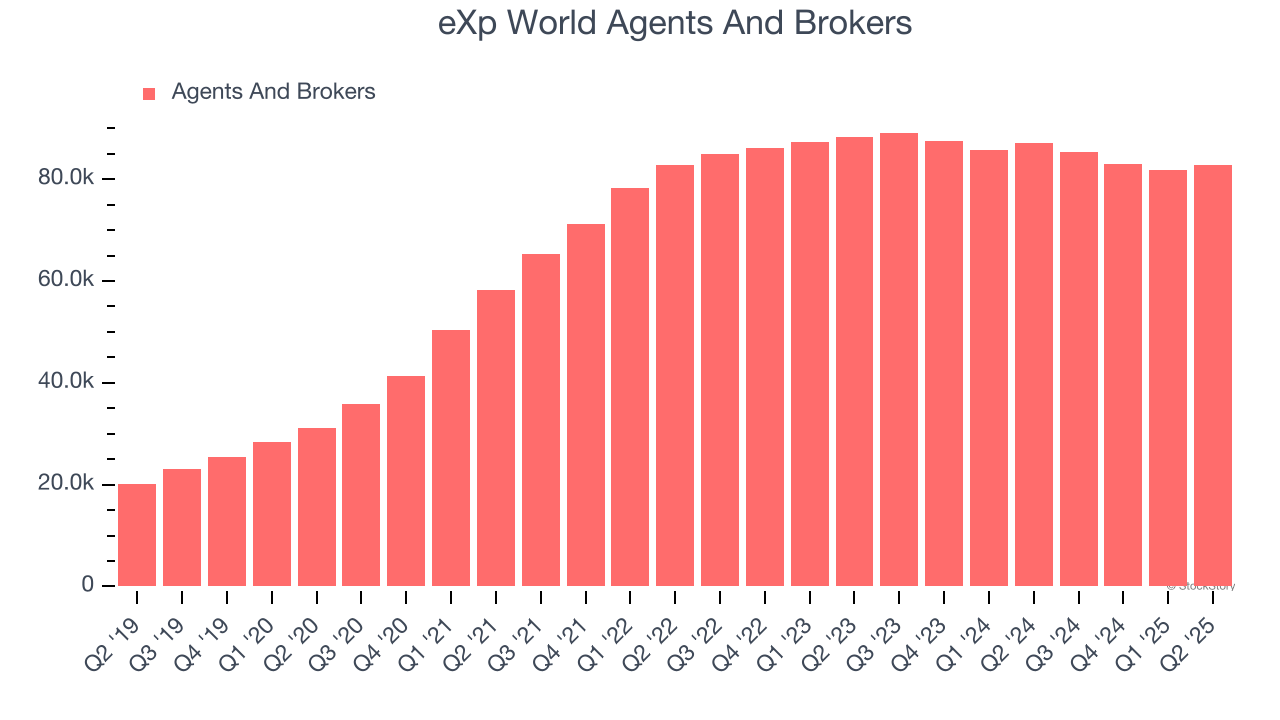
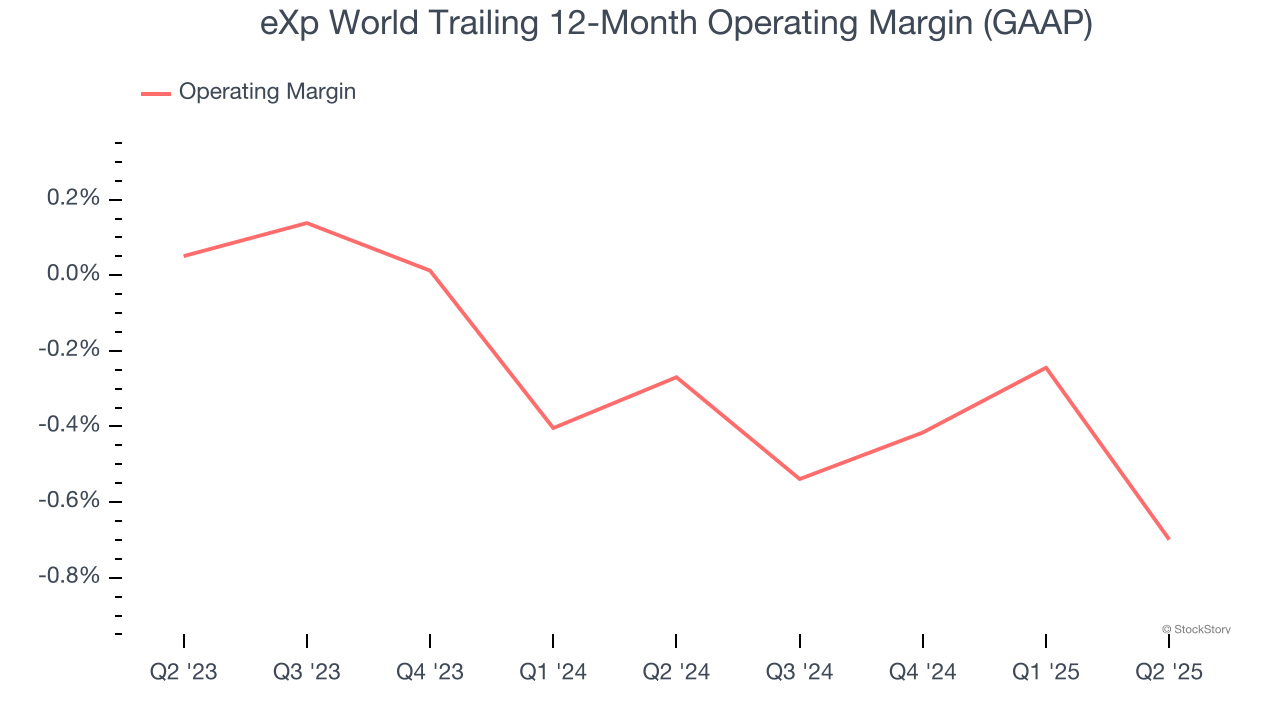
2. Breakeven Operating Margin Raises Questions
Operating margin is a key measure of profitability. Think of it as net income - the bottom line - excluding the impact of taxes and interest on debt, which are less connected to business fundamentals.
eXp World’s operating margin might fluctuated slightly over the last 12 months but has remained more or less the same. The company broke even over the last two years, inadequate for a consumer discretionary business. Its large expense base and inefficient cost structure were the main culprits behind this performance.
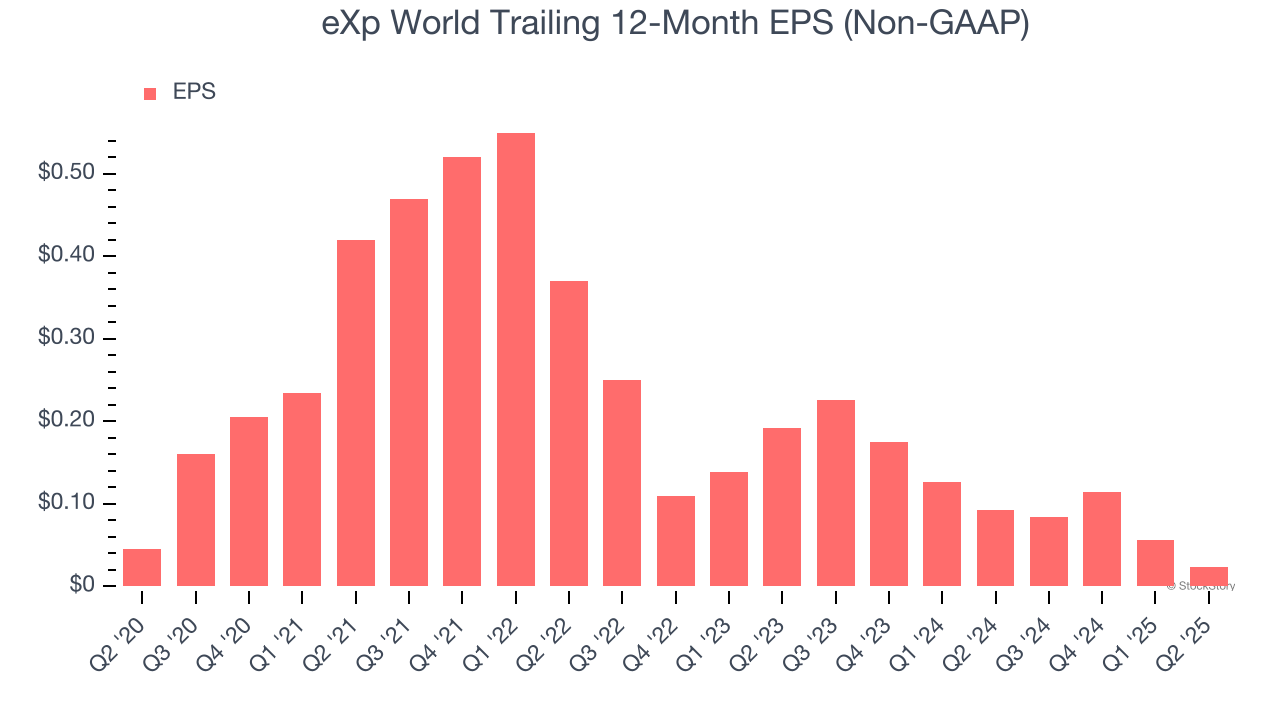
3. EPS Trending Down
Analyzing the long-term change in earnings per share (EPS) shows whether a company's incremental sales were profitable – for example, revenue could be inflated through excessive spending on advertising and promotions.
Sadly for eXp World, its EPS declined by 12.2% annually over the last five years while its revenue grew by 31.2%. This tells us the company became less profitable on a per-share basis as it expanded.
Final Judgment
We cheer for all companies serving everyday consumers, but in the case of eXp World, we’ll be cheering from the sidelines. With its shares underperforming the market lately, the stock trades at 24.2× forward EV-to-EBITDA (or $10.77 per share). This valuation tells us a lot of optimism is priced in - we think other companies feature superior fundamentals at the moment. We’d recommend looking at an all-weather company that owns household favorite Taco Bell.
Stocks We Would Buy Instead of eXp World
Trump’s April 2025 tariff bombshell triggered a massive market selloff, but stocks have since staged an impressive recovery, leaving those who panic sold on the sidelines.
Take advantage of the rebound by checking out our Top 9 Market-Beating Stocks. This is a curated list of our High Quality stocks that have generated a market-beating return of 183% over the last five years (as of March 31st 2025).
Stocks that made our list in 2020 include now familiar names such as Nvidia (+1,545% between March 2020 and March 2025) as well as under-the-radar businesses like the once-micro-cap company Tecnoglass (+1,754% five-year return). Find your next big winner with StockStory today.
StockStory is growing and hiring equity analyst and marketing roles. Are you a 0 to 1 builder passionate about the markets and AI? See the open roles here.


