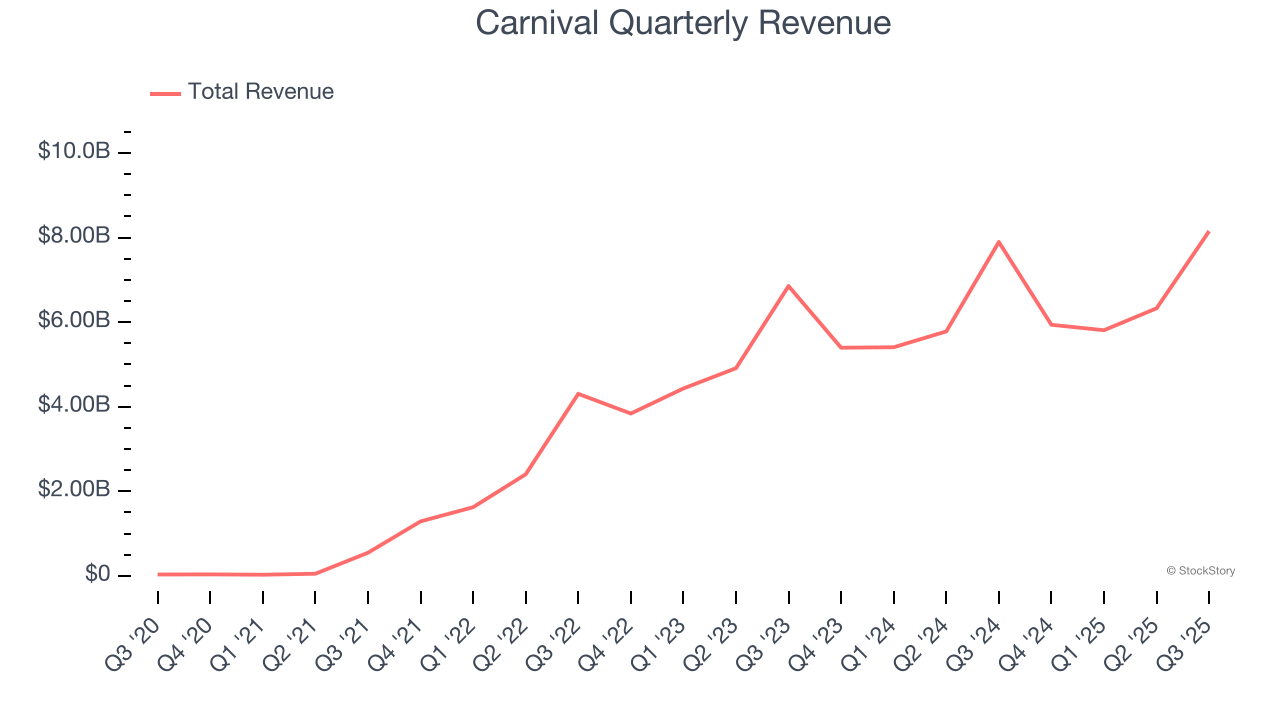
Cruise ship company Carnival (NYSE: CCL) beat Wall Street’s revenue expectations in Q3 CY2025, with sales up 3.3% year on year to $8.15 billion. Its non-GAAP profit of $1.43 per share was 8.5% above analysts’ consensus estimates.
Is now the time to buy Carnival? Find out by accessing our full research report, it’s free.
Carnival (CCL) Q3 CY2025 Highlights:
- Revenue: $8.15 billion vs analyst estimates of $8.11 billion (3.3% year-on-year growth, 0.5% beat)
- Adjusted EPS: $1.43 vs analyst estimates of $1.32 (8.5% beat)
- Adjusted EBITDA: $2.99 billion vs analyst estimates of $2.9 billion (36.7% margin, 3.2% beat)
- Management raised its full-year Adjusted EPS guidance to $2.14 at the midpoint, a 8.6% increase
- EBITDA guidance for the full year is $7.05 billion at the midpoint, above analyst estimates of $6.99 billion
- Operating Margin: 27.9%, in line with the same quarter last year
- Free Cash Flow Margin: 24.9%, up from 7.9% in the same quarter last year
- Passenger Cruise Days: 27.5 million, down 600,000 year on year
- Market Capitalization: $39.76 billion
"This was a phenomenal quarter delivering all-time high net income and our tenth consecutive quarter of record revenues. Strong demand and onboard spending drove a 4.6% improvement in net yields (in constant currency), all of which was achieved on a same ship basis," commented Carnival Corporation & plc's Chief Executive Officer Josh Weinstein.
Company Overview
Boasting outrageous amenities like a planetarium on board its ships, Carnival (NYSE: CCL) is one of the world's largest leisure travel companies and a prominent player in the cruise industry.
Revenue Growth
Examining a company’s long-term performance can provide clues about its quality. Even a bad business can shine for one or two quarters, but a top-tier one grows for years. Luckily, Carnival’s sales grew at a solid 20.5% compounded annual growth rate over the last five years. Its growth beat the average consumer discretionary company and shows its offerings resonate with customers.
We at StockStory place the most emphasis on long-term growth, but within consumer discretionary, a stretched historical view may miss a company riding a successful new property or trend. Carnival’s recent performance shows its demand has slowed as its annualized revenue growth of 14.4% over the last two years was below its five-year trend. 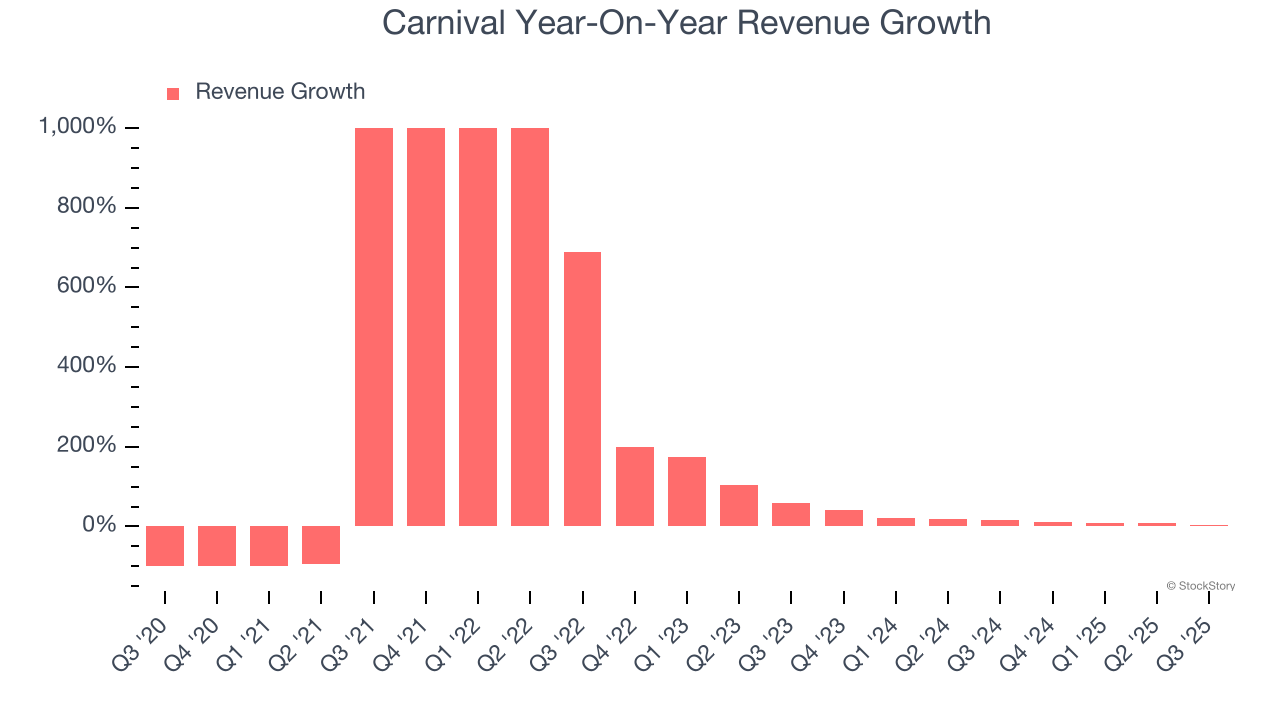
We can better understand the company’s revenue dynamics by analyzing its number of passenger cruise days, which reached 27.5 million in the latest quarter. Over the last two years, Carnival’s passenger cruise days averaged 9.4% year-on-year growth. Because this number is lower than its revenue growth during the same period, we can see the company’s monetization has risen. 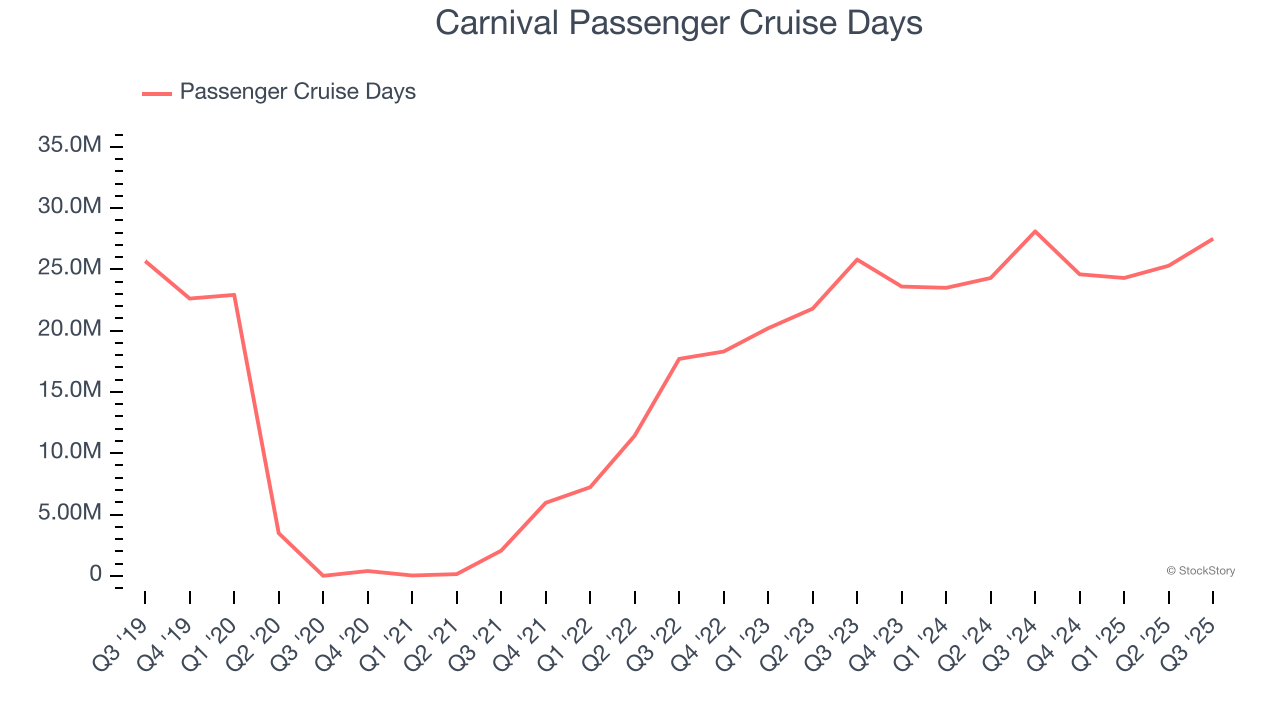
This quarter, Carnival reported modest year-on-year revenue growth of 3.3% but beat Wall Street’s estimates by 0.5%.
Looking ahead, sell-side analysts expect revenue to grow 4.5% over the next 12 months, a deceleration versus the last two years. This projection doesn't excite us and indicates its products and services will see some demand headwinds.
Today’s young investors won’t have read the timeless lessons in Gorilla Game: Picking Winners In High Technology because it was written more than 20 years ago when Microsoft and Apple were first establishing their supremacy. But if we apply the same principles, then enterprise software stocks leveraging their own generative AI capabilities may well be the Gorillas of the future. So, in that spirit, we are excited to present our Special Free Report on a profitable, fast-growing enterprise software stock that is already riding the automation wave and looking to catch the generative AI next.
Operating Margin
Operating margin is a key measure of profitability. Think of it as net income - the bottom line - excluding the impact of taxes and interest on debt, which are less connected to business fundamentals.
Carnival’s operating margin has been trending up over the last 12 months and averaged 15.2% over the last two years. Its solid profitability for a consumer discretionary business shows it’s an efficient company that manages its expenses effectively.
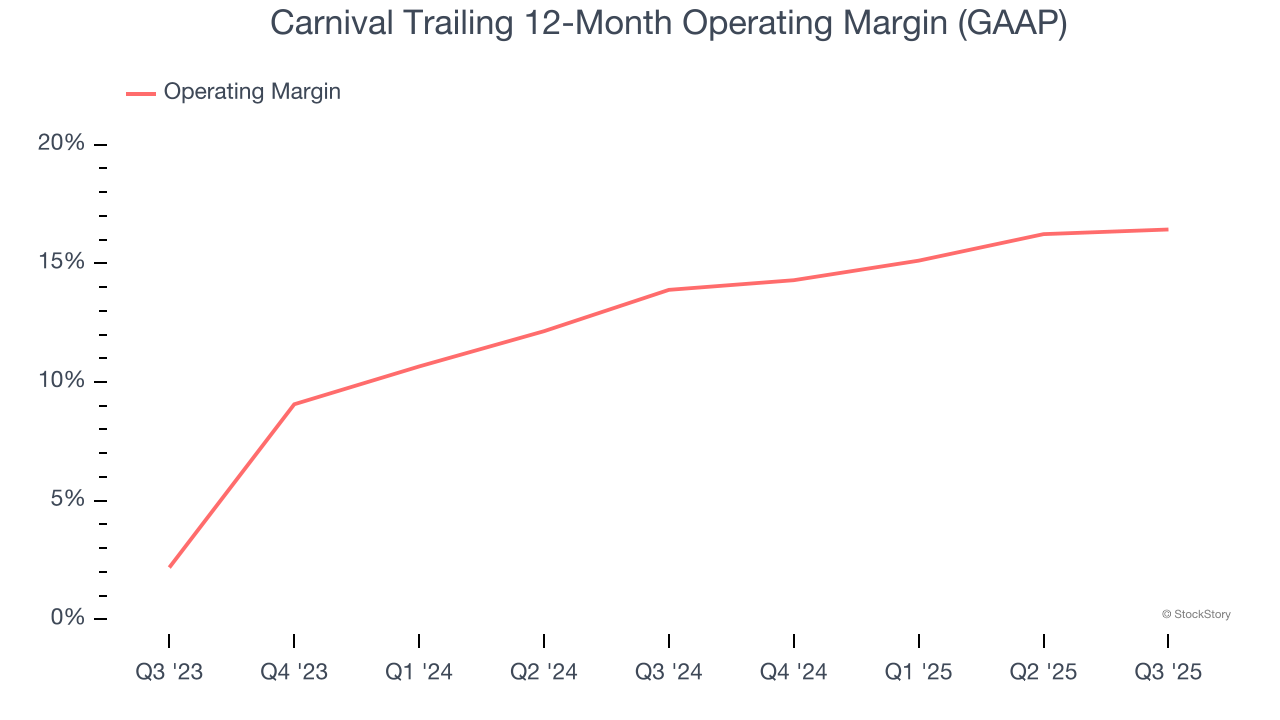
This quarter, Carnival generated an operating margin profit margin of 27.9%, in line with the same quarter last year. This indicates the company’s overall cost structure has been relatively stable.
Earnings Per Share
We track the long-term change in earnings per share (EPS) for the same reason as long-term revenue growth. Compared to revenue, however, EPS highlights whether a company’s growth is profitable.
Carnival’s full-year EPS flipped from negative to positive over the last five years. This is encouraging and shows it’s at a critical moment in its life.
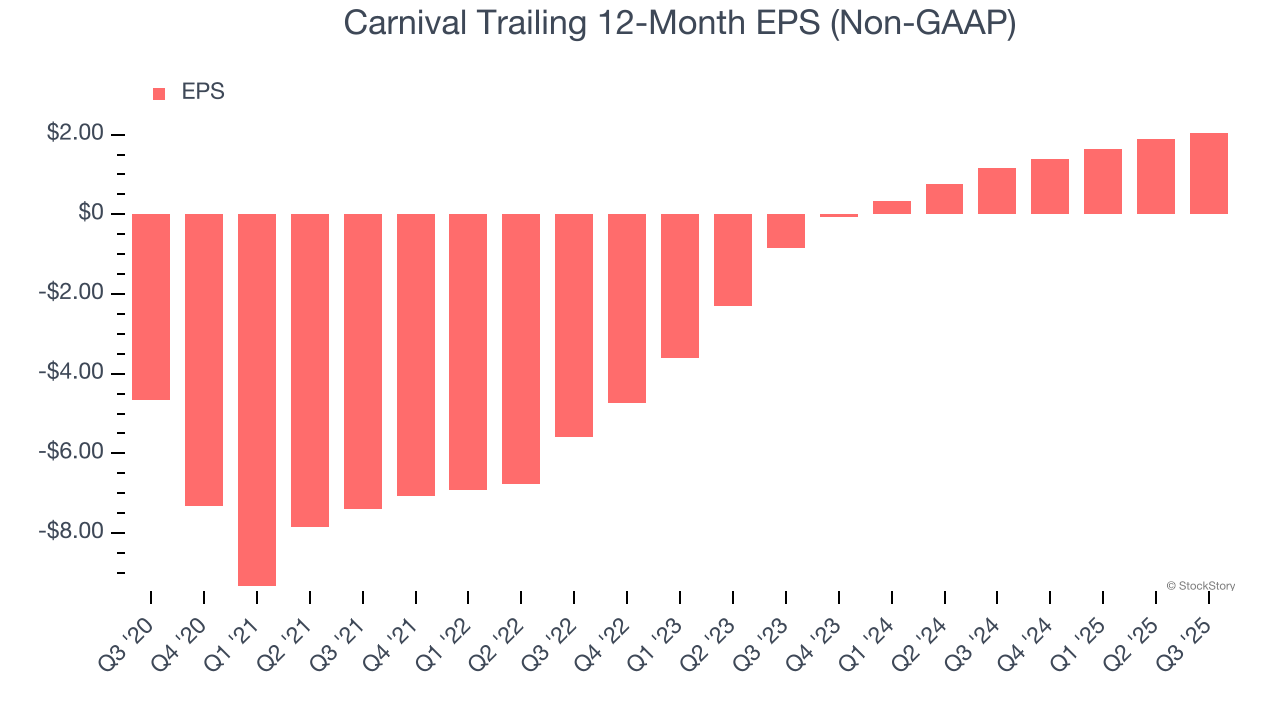
In Q3, Carnival reported adjusted EPS of $1.43, up from $1.27 in the same quarter last year. This print beat analysts’ estimates by 8.5%. Over the next 12 months, Wall Street expects Carnival’s full-year EPS of $2.05 to grow 11%.
Key Takeaways from Carnival’s Q3 Results
It was good to see Carnival beat analysts’ EPS expectations this quarter. We were also happy its EBITDA outperformed Wall Street’s estimates. On the other hand, its . Overall, this print had some key positives. Investors were likely hoping for more, and shares traded down 2.6% to $29.82 immediately following the results.
Is Carnival an attractive investment opportunity right now? The latest quarter does matter, but not nearly as much as longer-term fundamentals and valuation, when deciding if the stock is a buy. We cover that in our actionable full research report which you can read here, it’s free.