Young adult apparel retailer American Eagle Outfitters (NYSE: AEO) beat Wall Street’s revenue expectations in Q2 CY2025, but sales were flat year on year at $1.28 billion. Its GAAP profit of $0.45 per share was significantly above analysts’ consensus estimates.
Is now the time to buy American Eagle? Find out by accessing our full research report, it’s free.
American Eagle (AEO) Q2 CY2025 Highlights:
- Revenue: $1.28 billion vs analyst estimates of $1.23 billion (flat year on year, 4% beat)
- EPS (GAAP): $0.45 vs analyst estimates of $0.21 (significant beat)
- Adjusted EBITDA: $157.8 million vs analyst estimates of $99.38 million (12.3% margin, 58.7% beat)
- Issues full-year operating profit guidance well above Wall Street Consensus
- Operating Margin: 8%, in line with the same quarter last year
- Locations: 1,185 at quarter end, up from 1,178 in the same quarter last year
- Same-Store Sales fell 1% year on year (4% in the same quarter last year)
- Market Capitalization: $2.34 billion
“We were pleased to see an improvement in the business during the second quarter driven by higher demand, lower promotions and well-managed expenses, all of which exceeded our expectations,” said Jay Schottenstein, Executive Chairman of the Board and Chief Executive Officer,
Company Overview
With a heavy focus on denim, American Eagle Outfitters (NYSE: AEO) is a specialty retailer offering an assortment of apparel and accessories to young adults.
Revenue Growth
Examining a company’s long-term performance can provide clues about its quality. Any business can have short-term success, but a top-tier one grows for years.
With $5.27 billion in revenue over the past 12 months, American Eagle is a mid-sized retailer, which sometimes brings disadvantages compared to larger competitors benefiting from better economies of scale.
As you can see below, American Eagle’s sales grew at a sluggish 3.9% compounded annual growth rate over the last six years (we compare to 2019 to normalize for COVID-19 impacts) as its store footprint remained unchanged.
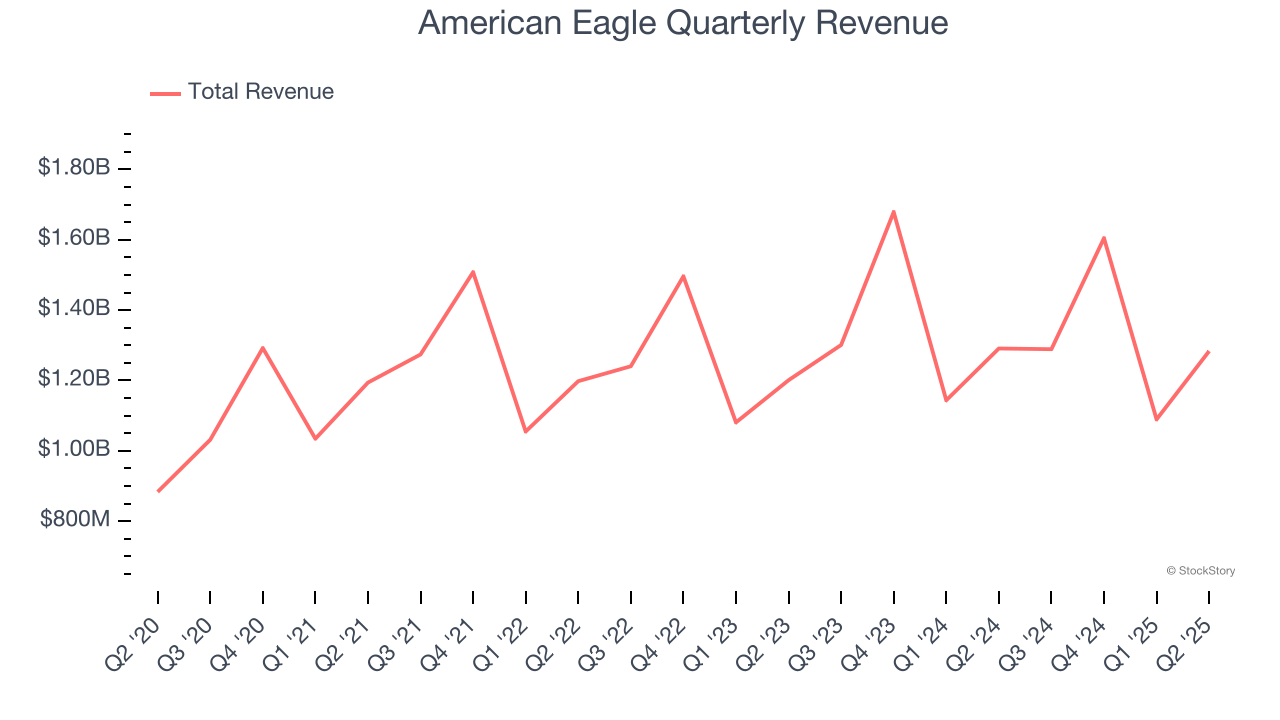
This quarter, American Eagle’s $1.28 billion of revenue was flat year on year but beat Wall Street’s estimates by 4%.
Looking ahead, sell-side analysts expect revenue to decline by 1.2% over the next 12 months, a deceleration versus the last six years. This projection is underwhelming and suggests its products will see some demand headwinds.
Today’s young investors won’t have read the timeless lessons in Gorilla Game: Picking Winners In High Technology because it was written more than 20 years ago when Microsoft and Apple were first establishing their supremacy. But if we apply the same principles, then enterprise software stocks leveraging their own generative AI capabilities may well be the Gorillas of the future. So, in that spirit, we are excited to present our Special Free Report on a profitable, fast-growing enterprise software stock that is already riding the automation wave and looking to catch the generative AI next.
Store Performance
Number of Stores
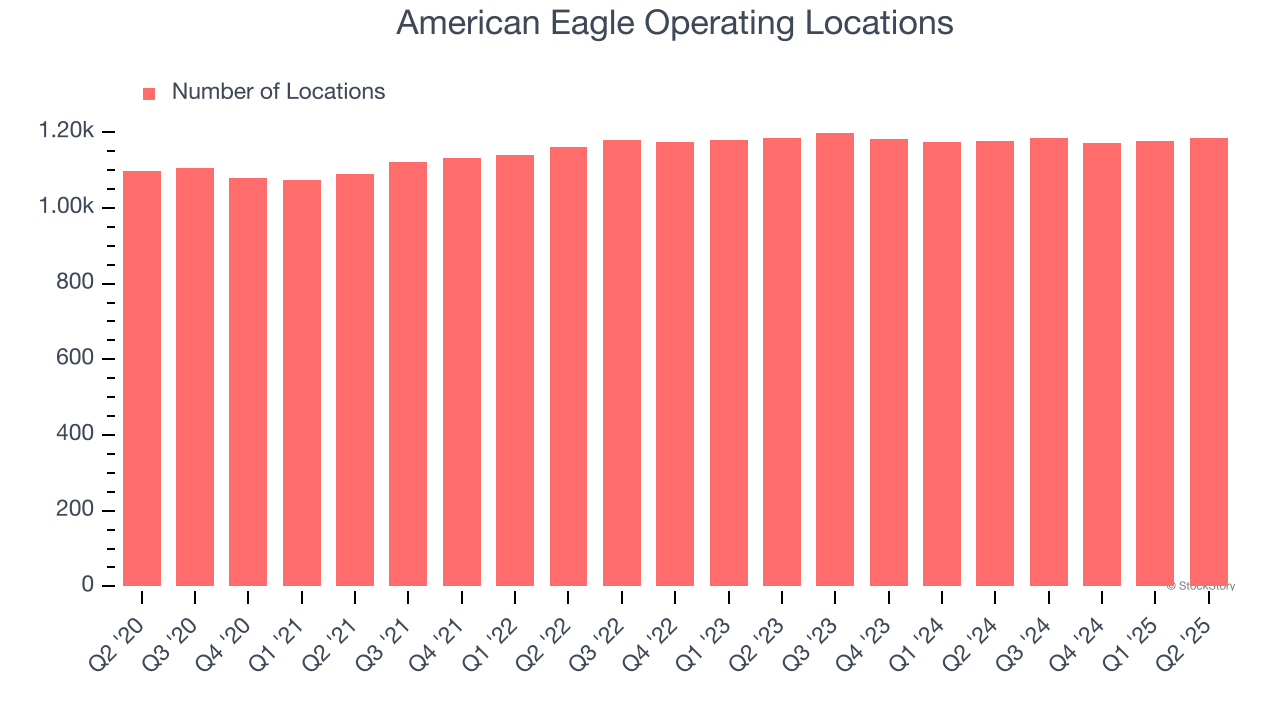
A retailer’s store count influences how much it can sell and how quickly revenue can grow.
American Eagle listed 1,185 locations in the latest quarter and has kept its store count flat over the last two years while other consumer retail businesses have opted for growth.
When a retailer keeps its store footprint steady, it usually means demand is stable and it’s focusing on operational efficiency to increase profitability.
Same-Store Sales
The change in a company's store base only tells one side of the story. The other is the performance of its existing locations and e-commerce sales, which informs management teams whether they should expand or downsize their physical footprints. Same-store sales provides a deeper understanding of this issue because it measures organic growth at brick-and-mortar shops for at least a year.
American Eagle’s demand has been spectacular for a retailer over the last two years. On average, the company has increased its same-store sales by an impressive 3.3% per year. Given its flat store base over the same period, this performance stems from not only increased foot traffic at existing locations but also higher e-commerce sales as demand shifts from in-store to online.
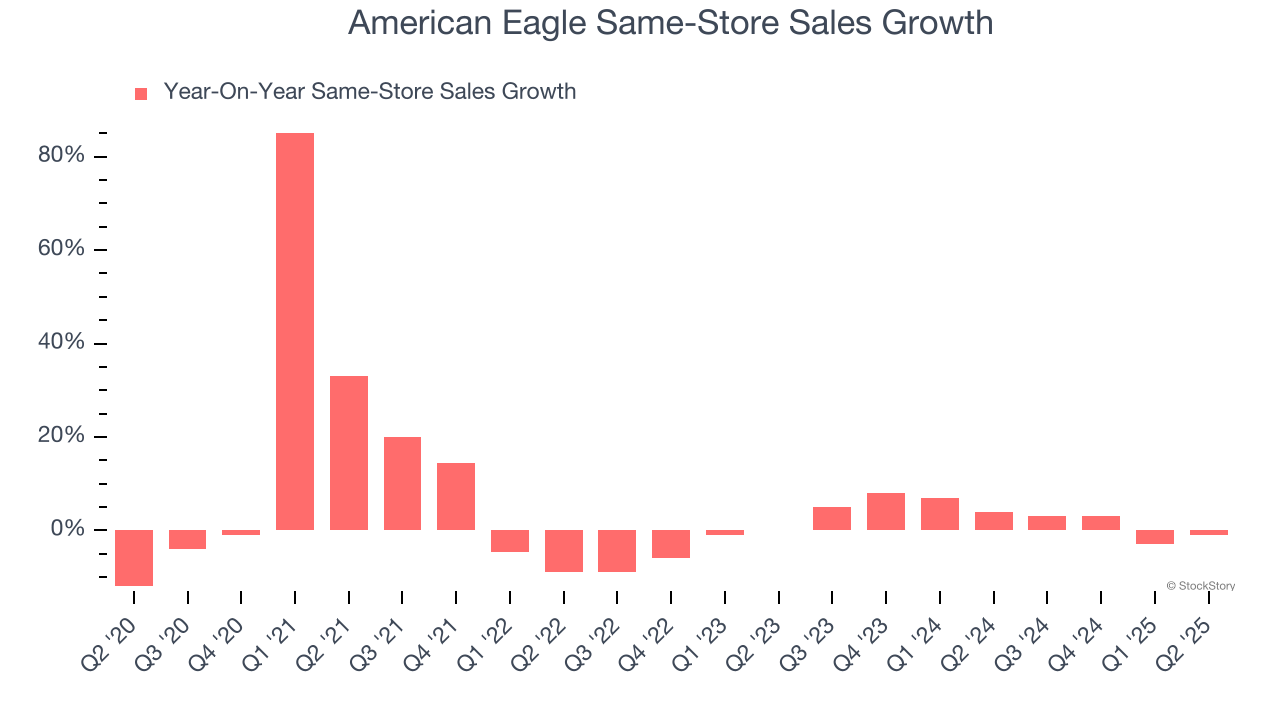
In the latest quarter, American Eagle’s same-store sales fell by 1% year on year. This decline was a reversal from its historical levels.
Key Takeaways from American Eagle’s Q2 Results
It was good to see American Eagle handily beat analysts’ EPS expectations this quarter driven by revenue and gross margin beats. The company also issued full-year operating profit well above expectations, and this is a major driver of a big stock more. Shares traded up 25.1% to $17.06 immediately following the results.
American Eagle may have had a good quarter, but does that mean you should invest right now? The latest quarter does matter, but not nearly as much as longer-term fundamentals and valuation, when deciding if the stock is a buy. We cover that in our actionable full research report which you can read here, it’s free.