Work management platform Asana (NYSE: ASAN) reported Q2 CY2025 results exceeding the market’s revenue expectations, with sales up 9.9% year on year to $196.9 million. The company expects next quarter’s revenue to be around $198.5 million, close to analysts’ estimates. Its non-GAAP profit of $0.06 per share was $0.01 above analysts’ consensus estimates.
Is now the time to buy Asana? Find out by accessing our full research report, it’s free.
Asana (ASAN) Q2 CY2025 Highlights:
- Revenue: $196.9 million vs analyst estimates of $193.1 million (9.9% year-on-year growth, 2% beat)
- Adjusted EPS: $0.06 vs analyst estimates of $0.05 ($0.01 beat)
- Adjusted Operating Income: $14.01 million vs analyst estimates of $9.34 million (7.1% margin, 50% beat)
- The company slightly lifted its revenue guidance for the full year to $785 million at the midpoint from $782.5 million
- Management raised its full-year Adjusted EPS guidance to $0.24 at the midpoint, a 9.1% increase
- Operating Margin: -25.1%, up from -42.9% in the same quarter last year
- Free Cash Flow Margin: 18%, up from 5.3% in the previous quarter
- Customers: 25,006 customers paying more than $5,000 annually
- Net Revenue Retention Rate: 96%, up from 95% in the previous quarter
- Billings: $220.3 million at quarter end, up 28.6% year on year
- Market Capitalization: $3.29 billion
Company Overview
Born from the founders' frustration with the inefficiencies of email-based collaboration at Facebook, Asana (NYSE: ASAN) provides a work management platform that helps organizations track projects, set goals, and manage workflows in a centralized digital workspace.
Revenue Growth
Reviewing a company’s long-term sales performance reveals insights into its quality. Any business can have short-term success, but a top-tier one grows for years. Over the last three years, Asana grew its sales at a 17.4% annual rate. Although this growth is acceptable on an absolute basis, it fell slightly short of our standards for the software sector, which enjoys a number of secular tailwinds.
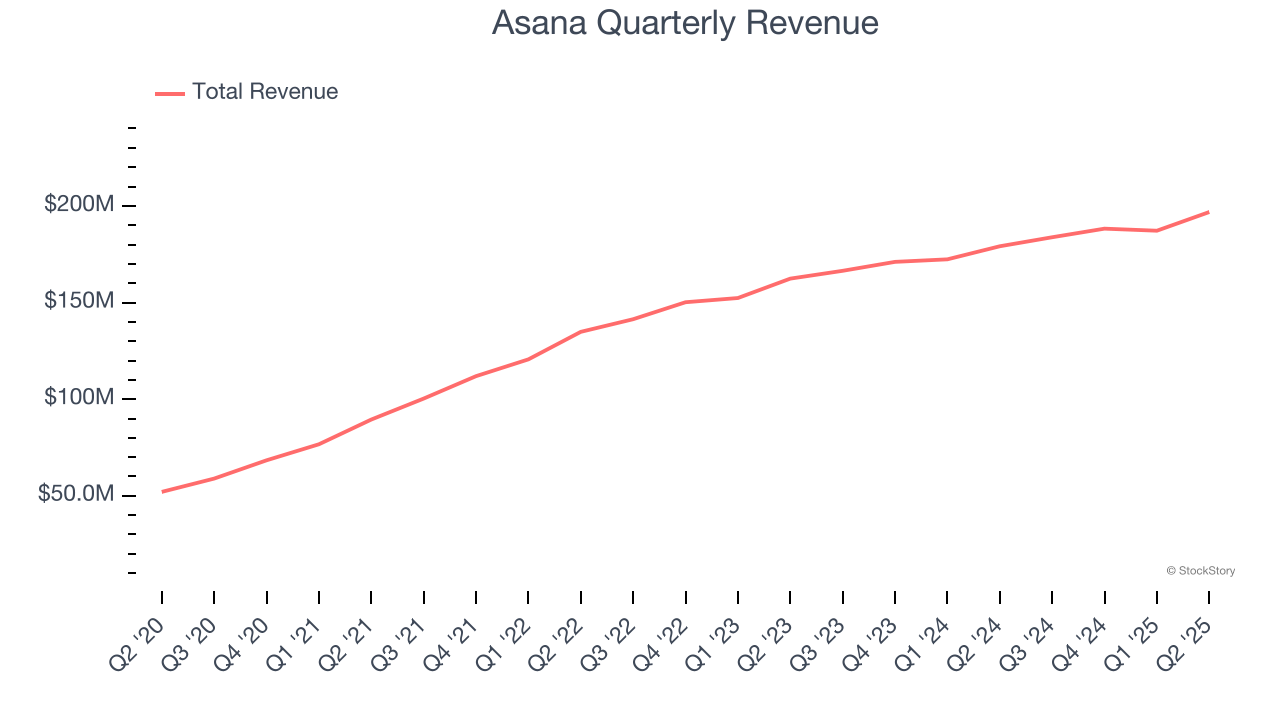
This quarter, Asana reported year-on-year revenue growth of 9.9%, and its $196.9 million of revenue exceeded Wall Street’s estimates by 2%. Company management is currently guiding for a 7.9% year-on-year increase in sales next quarter.
Looking further ahead, sell-side analysts expect revenue to grow 7.7% over the next 12 months, a deceleration versus the last three years. This projection is underwhelming and indicates its products and services will see some demand headwinds.
Unless you’ve been living under a rock, it should be obvious by now that generative AI is going to have a huge impact on how large corporations do business. While Nvidia and AMD are trading close to all-time highs, we prefer a lesser-known (but still profitable) stock benefiting from the rise of AI. Click here to access our free report one of our favorites growth stories.
Billings
Billings is a non-GAAP metric that is often called “cash revenue” because it shows how much money the company has collected from customers in a certain period. This is different from revenue, which must be recognized in pieces over the length of a contract.
Asana’s billings came in at $220.3 million in Q2, and over the last four quarters, its growth slightly lagged the sector as it averaged 9.6% year-on-year increases. This performance mirrored its total sales and suggests that increasing competition is causing challenges in acquiring/retaining customers. 
Customer Retention
One of the best parts about the software-as-a-service business model (and a reason why they trade at high valuation multiples) is that customers typically spend more on a company’s products and services over time.
Asana’s net revenue retention rate, a key performance metric measuring how much money existing customers from a year ago are spending today, was 95.7% in Q2. This means Asana’s revenue would’ve decreased by 4.3% over the last 12 months if it didn’t win any new customers.
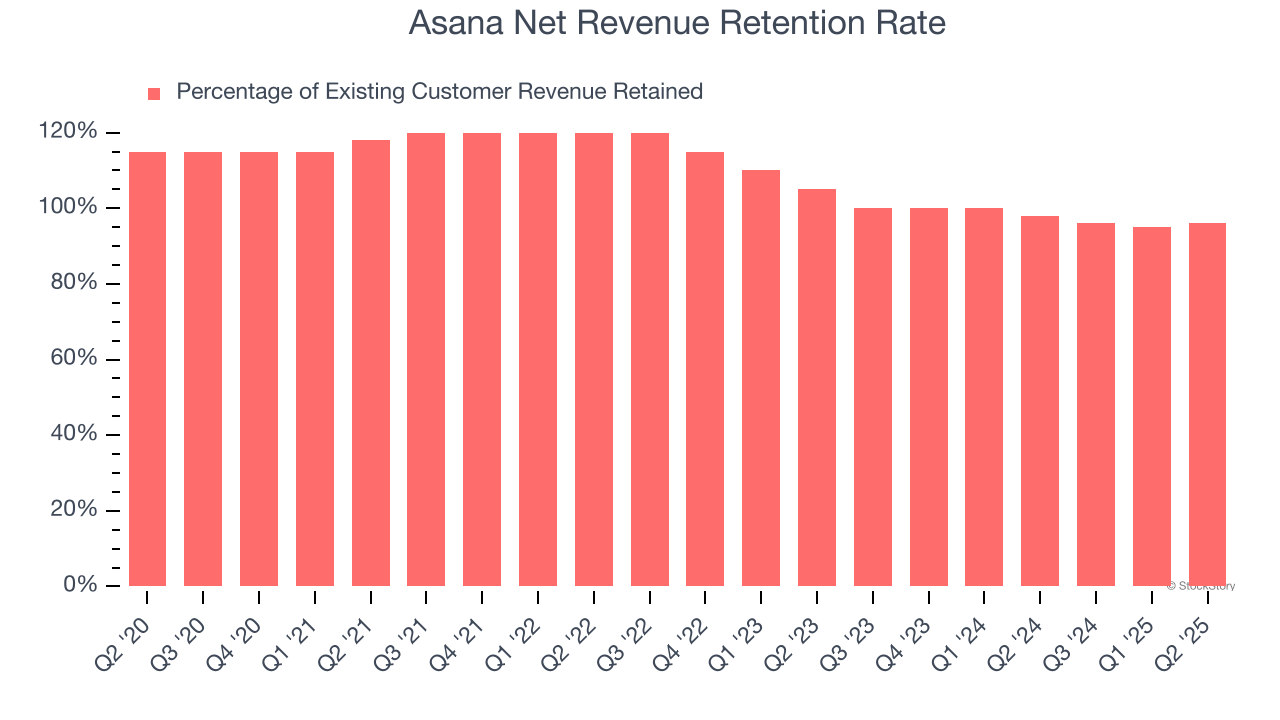
Asana has a weak net retention rate, signaling that some customers aren’t satisfied with its products, leading to lost contracts and revenue streams.
Key Takeaways from Asana’s Q2 Results
This was a beat and raise quarter. We liked that both revenue and operating profit exceeded expectations. We were also impressed by Asana’s optimistic EPS guidance for next quarter, which blew past analysts’ expectations. We were also glad its full-year EPS guidance trumped Wall Street’s estimates. Overall, we think this was still a solid quarter with some key areas of upside. The stock traded up 7.7% to $15.34 immediately following the results.
Asana had an encouraging quarter, but one earnings result doesn’t necessarily make the stock a buy. Let’s see if this is a good investment. If you’re making that decision, you should consider the bigger picture of valuation, business qualities, as well as the latest earnings. We cover that in our actionable full research report which you can read here, it’s free.