Discount treasure-hunt retailer Dollar Tree (NASDAQ: DLTR) reported Q2 CY2025 results beating Wall Street’s revenue expectations, but sales fell by 38.1% year on year to $4.57 billion. The company’s full-year revenue guidance of $19.4 billion at the midpoint came in 1.3% above analysts’ estimates. Its non-GAAP profit of $0.77 per share was 87.6% above analysts’ consensus estimates.
Is now the time to buy Dollar Tree? Find out by accessing our full research report, it’s free.
Dollar Tree (DLTR) Q2 CY2025 Highlights:
- Revenue: $4.57 billion vs analyst estimates of $4.48 billion (38.1% year-on-year decline, 2% beat)
- Adjusted EPS: $0.77 vs analyst estimates of $0.41 (87.6% beat)
- The company lifted its revenue guidance for the full year to $19.4 billion at the midpoint from $18.8 billion, a 3.2% increase
- Management raised its full-year Adjusted EPS guidance to $5.52 at the midpoint, a 2.2% increase
- Operating Margin: 5.1%, up from 2.8% in the same quarter last year
- Free Cash Flow was -$88.8 million compared to -$195.9 million in the same quarter last year
- Same-Store Sales rose 6.5% year on year (0.7% in the same quarter last year)
- Market Capitalization: $23.24 billion
Company Overview
A treasure hunt because there’s no guarantee of consistent product selection, Dollar Tree (NASDAQ: DLTR) is a discount retailer that sells general merchandise and select packaged food at extremely low prices.
Revenue Growth
A company’s long-term sales performance can indicate its overall quality. Even a bad business can shine for one or two quarters, but a top-tier one grows for years.
With $21.78 billion in revenue over the past 12 months, Dollar Tree is one of the larger companies in the consumer retail industry and benefits from a well-known brand that influences purchasing decisions. However, its scale is a double-edged sword because there is only so much real estate to build new stores, placing a ceiling on its growth. To accelerate sales, Dollar Tree likely needs to optimize its pricing or lean into international expansion.
As you can see below, Dollar Tree’s revenue declined by 1.1% per year over the last six years (we compare to 2019 to normalize for COVID-19 impacts) as it didn’t open many new stores.
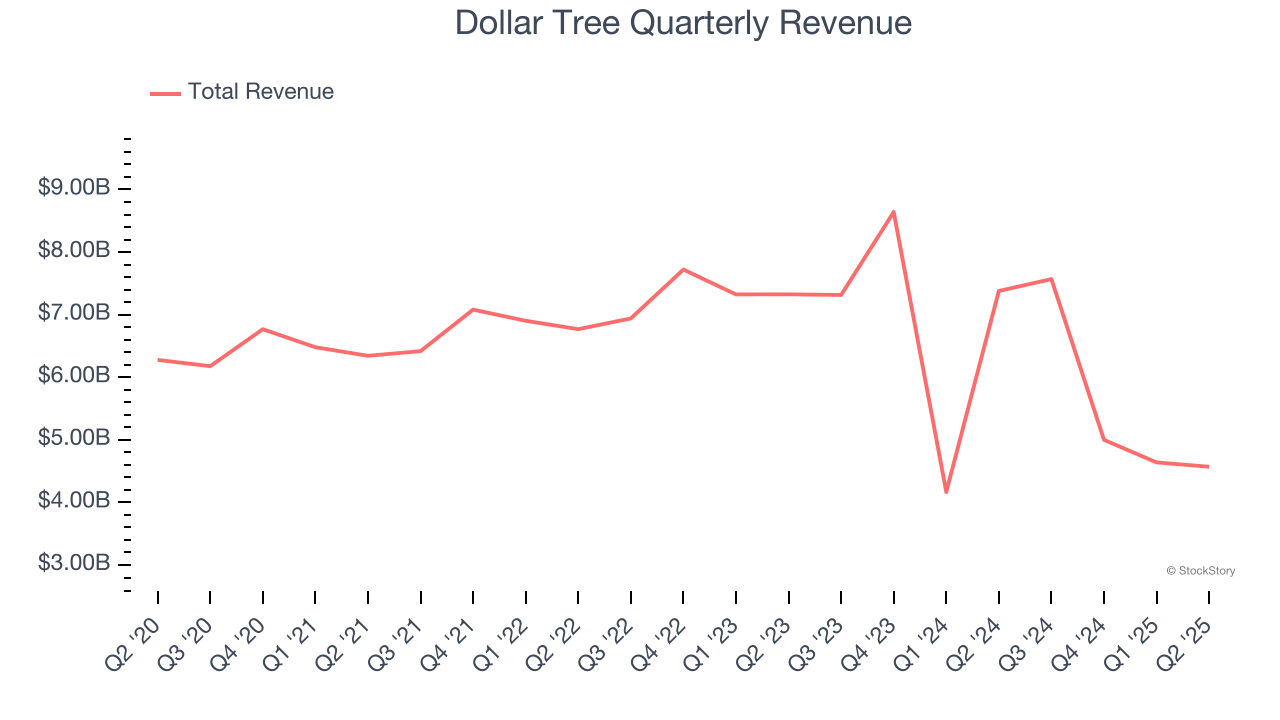
This quarter, Dollar Tree’s revenue fell by 38.1% year on year to $4.57 billion but beat Wall Street’s estimates by 2%.
Looking ahead, sell-side analysts expect revenue to decline by 9.6% over the next 12 months, a deceleration versus the last six years. This projection doesn't excite us and indicates its products will see some demand headwinds.
Here at StockStory, we certainly understand the potential of thematic investing. Diverse winners from Microsoft (MSFT) to Alphabet (GOOG), Coca-Cola (KO) to Monster Beverage (MNST) could all have been identified as promising growth stories with a megatrend driving the growth. So, in that spirit, we’ve identified a relatively under-the-radar profitable growth stock benefiting from the rise of AI, available to you FREE via this link.
Store Performance
Number of Stores
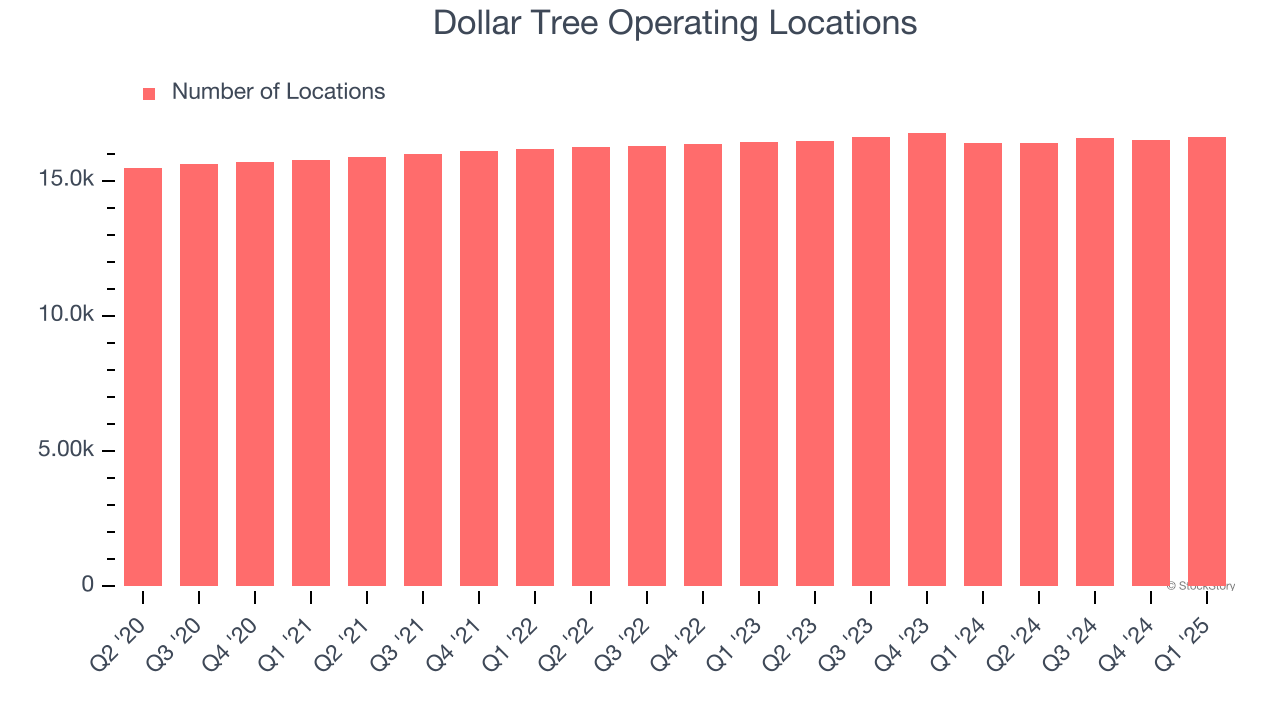
A retailer’s store count often determines how much revenue it can generate.
Over the last two years, Dollar Tree has kept its store count flat while other consumer retail businesses have opted for growth.
When a retailer keeps its store footprint steady, it usually means demand is stable and it’s focusing on operational efficiency to increase profitability.
Note that Dollar Tree reports its store count intermittently, so some data points are missing in the chart below.
Same-Store Sales
A company's store base only paints one part of the picture. When demand is high, it makes sense to open more. But when demand is low, it’s prudent to close some locations and use the money in other ways. Same-store sales provides a deeper understanding of this issue because it measures organic growth at brick-and-mortar shops for at least a year.
Dollar Tree’s demand has been healthy for a retailer over the last two years. On average, the company has grown its same-store sales by a robust 3% per year. Given its flat store base over the same period, this performance stems from not only increased foot traffic at existing locations but also higher e-commerce sales as demand shifts from in-store to online.
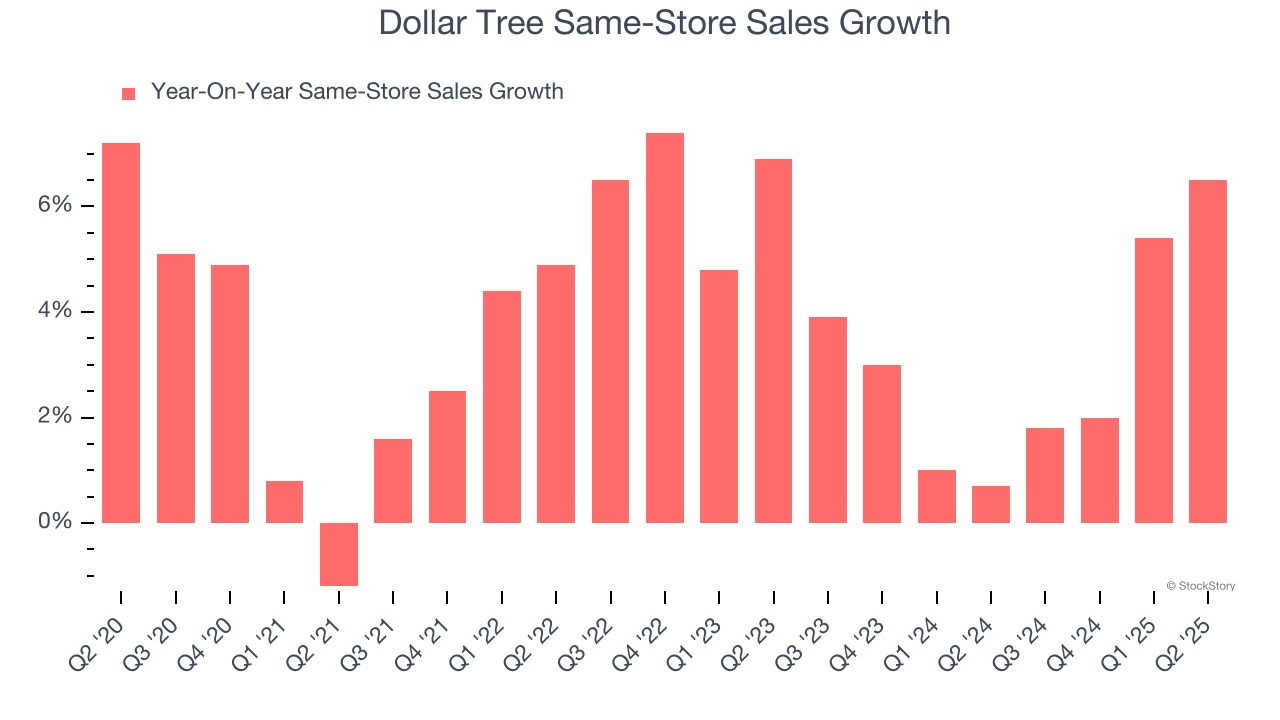
In the latest quarter, Dollar Tree’s same-store sales rose 6.5% year on year. This growth was an acceleration from its historical levels, which is always an encouraging sign.
Key Takeaways from Dollar Tree’s Q2 Results
This was a beat and raise quarter. Specifically, it was good to see Dollar Tree beat analysts’ revenue and EPS expectations this quarter. We were also excited that the company raised full-year guidance for revenue and EPS. Zooming out, we think this was a good print with some key areas of upside. The stock remained flat at $111.26 immediately after reporting.
Is Dollar Tree an attractive investment opportunity right now? If you’re making that decision, you should consider the bigger picture of valuation, business qualities, as well as the latest earnings. We cover that in our actionable full research report which you can read here, it’s free.