The end of the earnings season is always a good time to take a step back and see who shined (and who not so much). Let’s take a look at how general industrial machinery stocks fared in Q2, starting with John Bean (NYSE: JBTM).
Automation that increases efficiency and connected equipment that collects analyzable data have been trending, creating new demand for general industrial machinery companies. Those who innovate and create digitized solutions can spur sales and speed up replacement cycles, but all general industrial machinery companies are still at the whim of economic cycles. Consumer spending and interest rates, for example, can greatly impact the industrial production that drives demand for these companies’ offerings.
The 15 general industrial machinery stocks we track reported a satisfactory Q2. As a group, revenues beat analysts’ consensus estimates by 2.3% while next quarter’s revenue guidance was in line.
While some general industrial machinery stocks have fared somewhat better than others, they have collectively declined. On average, share prices are down 1.3% since the latest earnings results.
John Bean (NYSE: JBTM)
Tracing back to its invention of the mechanical milk bottle filler in 1884, John Bean (NYSE: JBT) designs, manufactures, and sells equipment used for food processing and aviation.
John Bean reported revenues of $934.8 million, up 132% year on year. This print exceeded analysts’ expectations by 4.9%. Overall, it was a strong quarter for the company with an impressive beat of analysts’ EBITDA estimates and a beat of analysts’ EPS estimates.
"We are pleased with our second quarter results, which exceeded our guidance, reflecting our ability to navigate a dynamic operating environment and manage the integration of two global businesses," said Brian Deck, Chief Executive Officer.
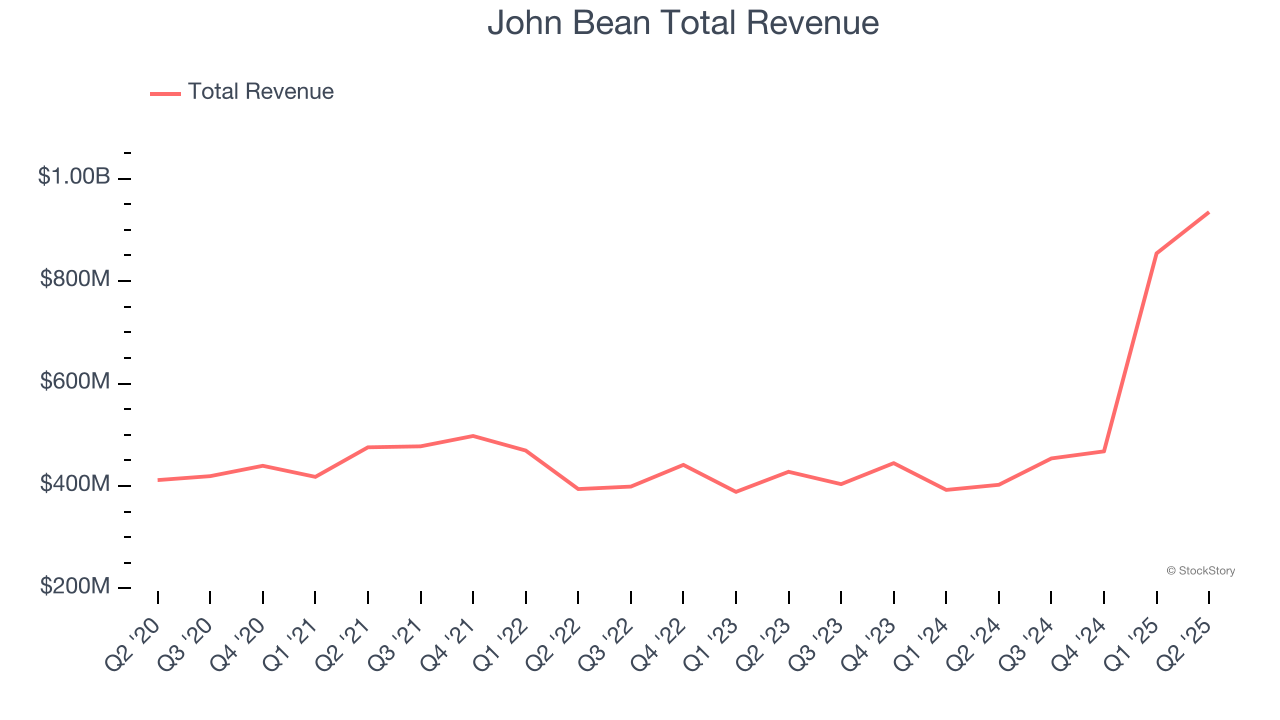
John Bean achieved the fastest revenue growth of the whole group. Unsurprisingly, the stock is up 6.4% since reporting and currently trades at $142.21.
Is now the time to buy John Bean? Access our full analysis of the earnings results here, it’s free.
Best Q2: Luxfer (NYSE: LXFR)
With its magnesium alloys used in the construction of the famous Spirit of St. Louis aircraft, Luxfer (NYSE: LXFR) offers specialized materials, components, and gas containment devices to various industries.
Luxfer reported revenues of $104 million, up 4.3% year on year, outperforming analysts’ expectations by 5.9%. The business had an incredible quarter with a beat of analysts’ EPS estimates and an impressive beat of analysts’ EBITDA estimates.
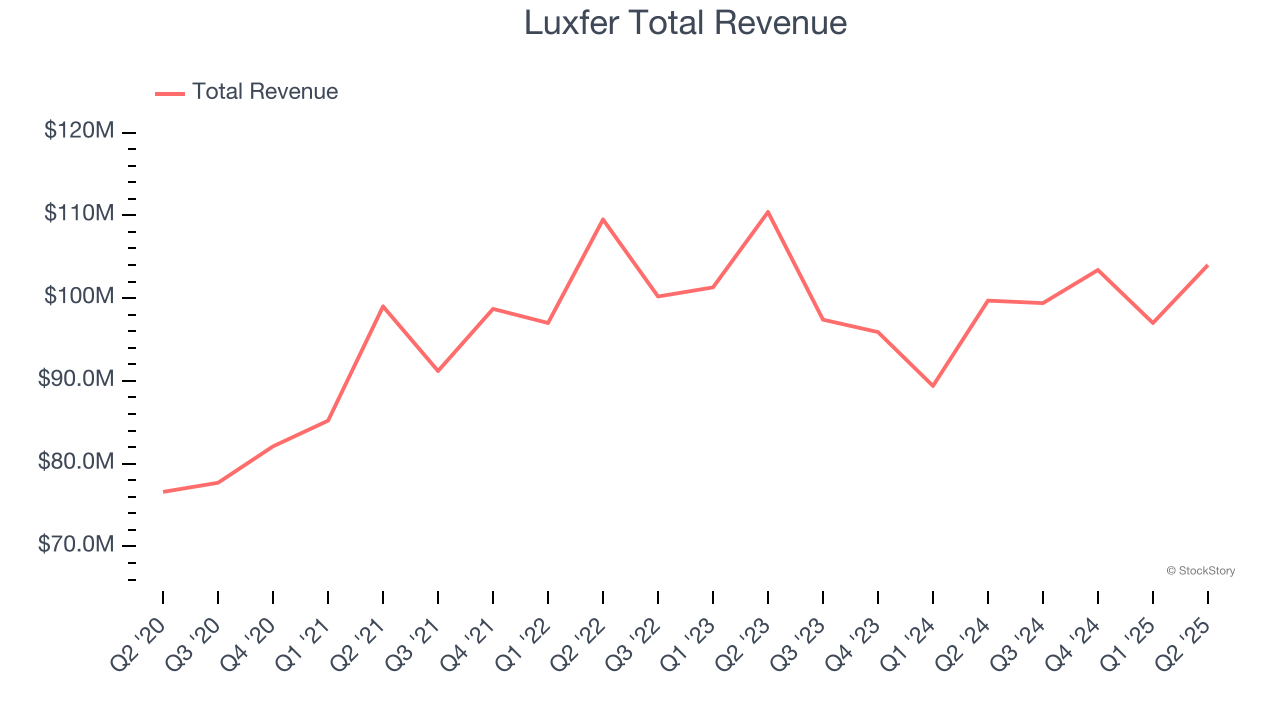
The market seems happy with the results as the stock is up 7.1% since reporting. It currently trades at $13.21.
Is now the time to buy Luxfer? Access our full analysis of the earnings results here, it’s free.
Weakest Q2: Icahn Enterprises (NASDAQ: IEP)
Founded in 1987, Icahn Enterprises (NASDAQ: IEP) is a diversified holding company primarily engaged in investment and asset management across various sectors.
Icahn Enterprises reported revenues of $2.32 billion, up 5.3% year on year, falling short of analysts’ expectations by 3%. It was a disappointing quarter as it posted a significant miss of analysts’ EPS estimates.
Icahn Enterprises delivered the weakest performance against analyst estimates in the group. As expected, the stock is down 5.6% since the results and currently trades at $8.48.
Read our full analysis of Icahn Enterprises’s results here.
Kadant (NYSE: KAI)
Headquartered in Massachusetts, Kadant (NYSE: KAI) is a global supplier of high-value, critical components and engineered systems used in process industries worldwide.
Kadant reported revenues of $255.3 million, down 7.1% year on year. This result surpassed analysts’ expectations by 3.8%. Overall, it was a very strong quarter as it also recorded a solid beat of analysts’ EBITDA estimates and an impressive beat of analysts’ adjusted operating income estimates.
The stock is down 7.5% since reporting and currently trades at $317.84.
Read our full, actionable report on Kadant here, it’s free.
Hillenbrand (NYSE: HI)
Hillenbrand, Inc. (NYSE: HI) is an industrial company that designs, manufactures, and sells highly engineered processing equipment and solutions for various industries.
Hillenbrand reported revenues of $598.9 million, down 23.9% year on year. This number beat analysts’ expectations by 4.6%. It was a strong quarter as it also logged full-year EBITDA guidance slightly topping analysts’ expectations and full-year revenue guidance slightly topping analysts’ expectations.
Hillenbrand had the slowest revenue growth among its peers. The stock is up 24.6% since reporting and currently trades at $24.66.
Read our full, actionable report on Hillenbrand here, it’s free.
Market Update
Thanks to the Fed’s series of rate hikes in 2022 and 2023, inflation has cooled significantly from its post-pandemic highs, drawing closer to the 2% goal. This disinflation has occurred without severely impacting economic growth, suggesting the success of a soft landing. The stock market thrived in 2024, spurred by recent rate cuts (0.5% in September and 0.25% in November), and a notable surge followed Donald Trump’s presidential election win in November, propelling indices to historic highs. Nonetheless, the outlook for 2025 remains clouded by potential trade policy changes and corporate tax discussions, which could impact business confidence and growth. The path forward holds both optimism and caution as new policies take shape.
Want to invest in winners with rock-solid fundamentals? Check out our Hidden Gem Stocks and add them to your watchlist. These companies are poised for growth regardless of the political or macroeconomic climate.
StockStory is growing and hiring equity analyst and marketing roles. Are you a 0 to 1 builder passionate about the markets and AI? See the open roles here.