Young adult apparel retailer Tilly’s (NYSE: TLYS) missed Wall Street’s revenue expectations in Q2 CY2025, with sales falling 7.1% year on year to $151.3 million. Next quarter’s revenue guidance of $137 million underwhelmed, coming in 2.9% below analysts’ estimates. Its GAAP profit of $0.10 per share was significantly above analysts’ consensus estimates.
Is now the time to buy Tilly's? Find out by accessing our full research report, it’s free.
Tilly's (TLYS) Q2 CY2025 Highlights:
- Revenue: $151.3 million vs analyst estimates of $154 million (7.1% year-on-year decline, 1.8% miss)
- EPS (GAAP): $0.10 vs analyst estimates of -$0.04 (significant beat)
- Adjusted EBITDA: $7.82 million vs analyst estimates of $1.6 million (5.2% margin, significant beat)
- Revenue Guidance for Q3 CY2025 is $137 million at the midpoint, below analyst estimates of $141.1 million
- EPS (GAAP) guidance for Q3 CY2025 is -$0.29 at the midpoint, beating analyst estimates by 21.6%
- Operating Margin: 1.8%, down from 3% in the same quarter last year
- Free Cash Flow Margin: 8.9%, up from 4.9% in the same quarter last year
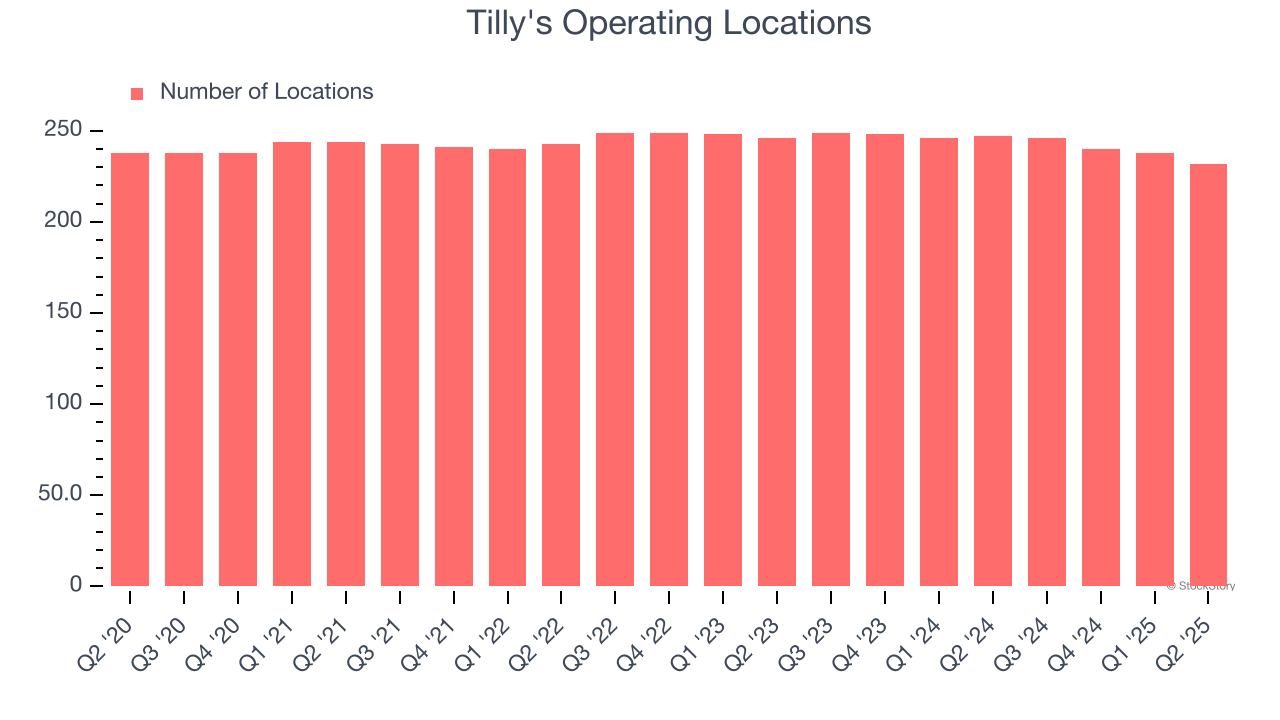
- Locations: 232 at quarter end, down from 247 in the same quarter last year
- Same-Store Sales fell 4.5% year on year (-7.9% in the same quarter last year)
- Market Capitalization: $53.97 million
Company Overview
With an emphasis on skate and surf culture, Tilly’s (NYSE: TLYS) is a specialty retailer that sells clothing, footwear, and accessories geared towards fashion-forward teens and young adults.
Revenue Growth
A company’s long-term performance is an indicator of its overall quality. Any business can have short-term success, but a top-tier one grows for years.
With $549.6 million in revenue over the past 12 months, Tilly's is a small retailer, which sometimes brings disadvantages compared to larger competitors benefiting from economies of scale and negotiating leverage with suppliers.
As you can see below, Tilly’s revenue declined by 1.7% per year over the last six years (we compare to 2019 to normalize for COVID-19 impacts) as it closed stores and observed lower sales at existing, established locations.
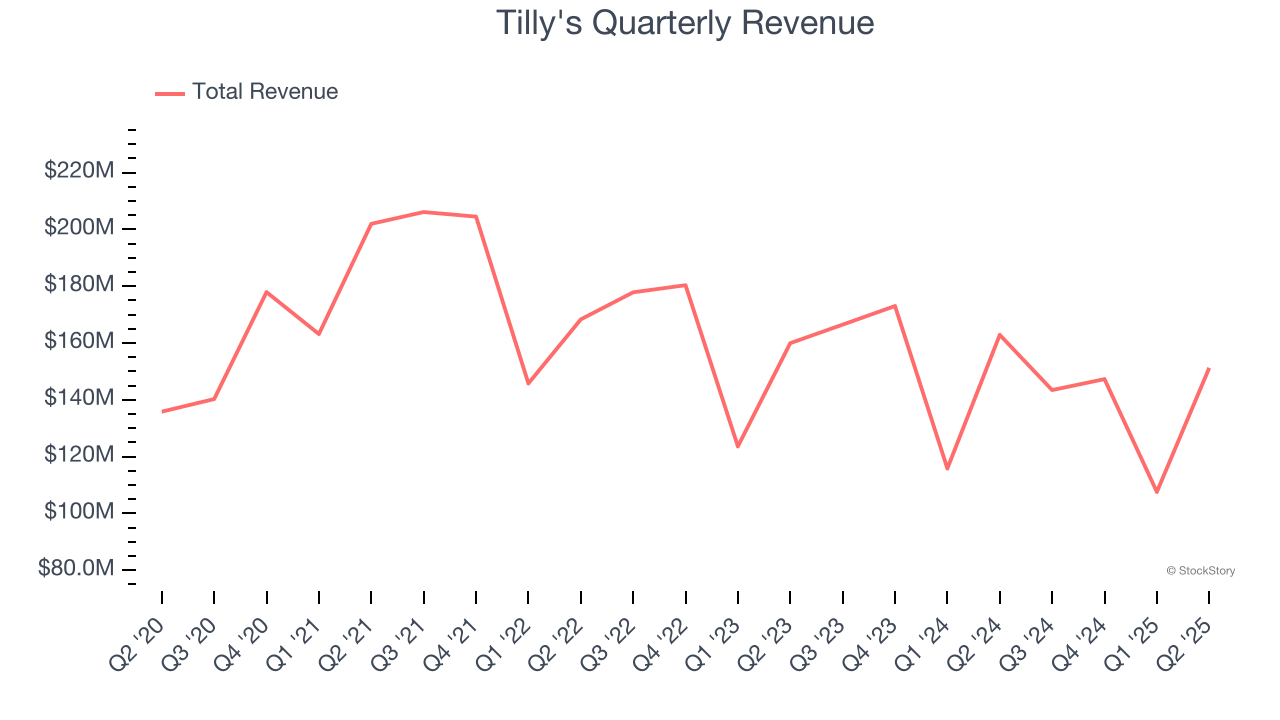
This quarter, Tilly's missed Wall Street’s estimates and reported a rather uninspiring 7.1% year-on-year revenue decline, generating $151.3 million of revenue. Company management is currently guiding for a 4.5% year-on-year decline in sales next quarter.
Looking further ahead, sell-side analysts expect revenue to remain flat over the next 12 months. This projection is underwhelming and indicates its newer products will not catalyze better top-line performance yet.
Here at StockStory, we certainly understand the potential of thematic investing. Diverse winners from Microsoft (MSFT) to Alphabet (GOOG), Coca-Cola (KO) to Monster Beverage (MNST) could all have been identified as promising growth stories with a megatrend driving the growth. So, in that spirit, we’ve identified a relatively under-the-radar profitable growth stock benefiting from the rise of AI, available to you FREE via this link.
Store Performance
Number of Stores
The number of stores a retailer operates is a critical driver of how quickly company-level sales can grow.
Tilly's operated 232 locations in the latest quarter. Over the last two years, the company has generally closed its stores, averaging 1.8% annual declines.
When a retailer shutters stores, it usually means that brick-and-mortar demand is less than supply, and it is responding by closing underperforming locations to improve profitability.
Same-Store Sales
A company's store base only paints one part of the picture. When demand is high, it makes sense to open more. But when demand is low, it’s prudent to close some locations and use the money in other ways. Same-store sales is an industry measure of whether revenue is growing at those existing stores and is driven by customer visits (often called traffic) and the average spending per customer (ticket).
Tilly’s demand has been shrinking over the last two years as its same-store sales have averaged 6.5% annual declines. This performance isn’t ideal, and Tilly's is attempting to boost same-store sales by closing stores (fewer locations sometimes lead to higher same-store sales).
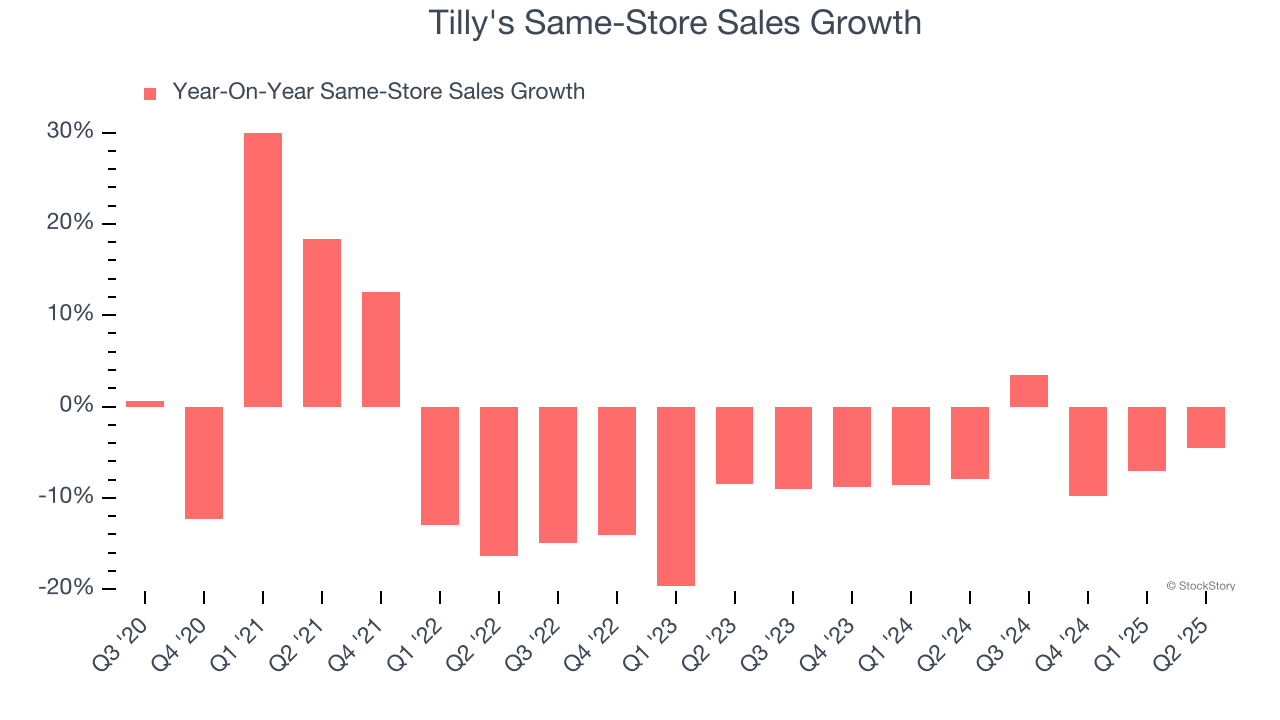
In the latest quarter, Tilly’s same-store sales fell by 4.5% year on year. This decrease represents a further deceleration from its historical levels. We hope the business can get back on track.
Key Takeaways from Tilly’s Q2 Results
Despite a revenue miss, EPS beat. We were also impressed by Tilly’s optimistic EPS guidance for next quarter, which blew past analysts’ expectations. On the other hand, its revenue guidance for next quarter missed. Investor seems to have lower expectations, and Tilly's is getting a pass on the revenue guidance miss. The stock traded up 20.1% to $2.45 immediately after reporting.
Indeed, Tilly's had a rock-solid quarterly earnings result, but is this stock a good investment here? When making that decision, it’s important to consider its valuation, business qualities, as well as what has happened in the latest quarter. We cover that in our actionable full research report which you can read here, it’s free.