Since September 2020, the S&P 500 has delivered a total return of 98.1%. But one standout stock has more than doubled the market - over the past five years, Cadence Design Systems has surged 227% to $348.24 per share. Its momentum hasn’t stopped as it’s also gained 36.9% in the last six months thanks to its solid quarterly results, beating the S&P by 18.3%.
Is it too late to buy CDNS? Find out in our full research report, it’s free.
Why Does CDNS Stock Spark Debate?
Powering the chips behind everything from smartphones to AI accelerators for over 35 years, Cadence Design Systems (NASDAQ: CDNS) provides essential computational software, hardware, and intellectual property used by engineers to design and verify advanced electronic systems and semiconductors.
Two Positive Attributes:
1. Billings Surge, Boosting Cash On Hand
Billings is a non-GAAP metric that is often called “cash revenue” because it shows how much money the company has collected from customers in a certain period. This is different from revenue, which must be recognized in pieces over the length of a contract.
Cadence Design Systems’s billings punched in at $1.32 billion in Q2, and over the last four quarters, its year-on-year growth averaged 25.5%. This performance was fantastic, indicating robust customer demand. The high level of cash collected from customers also enhances liquidity and provides a solid foundation for future investments and growth. 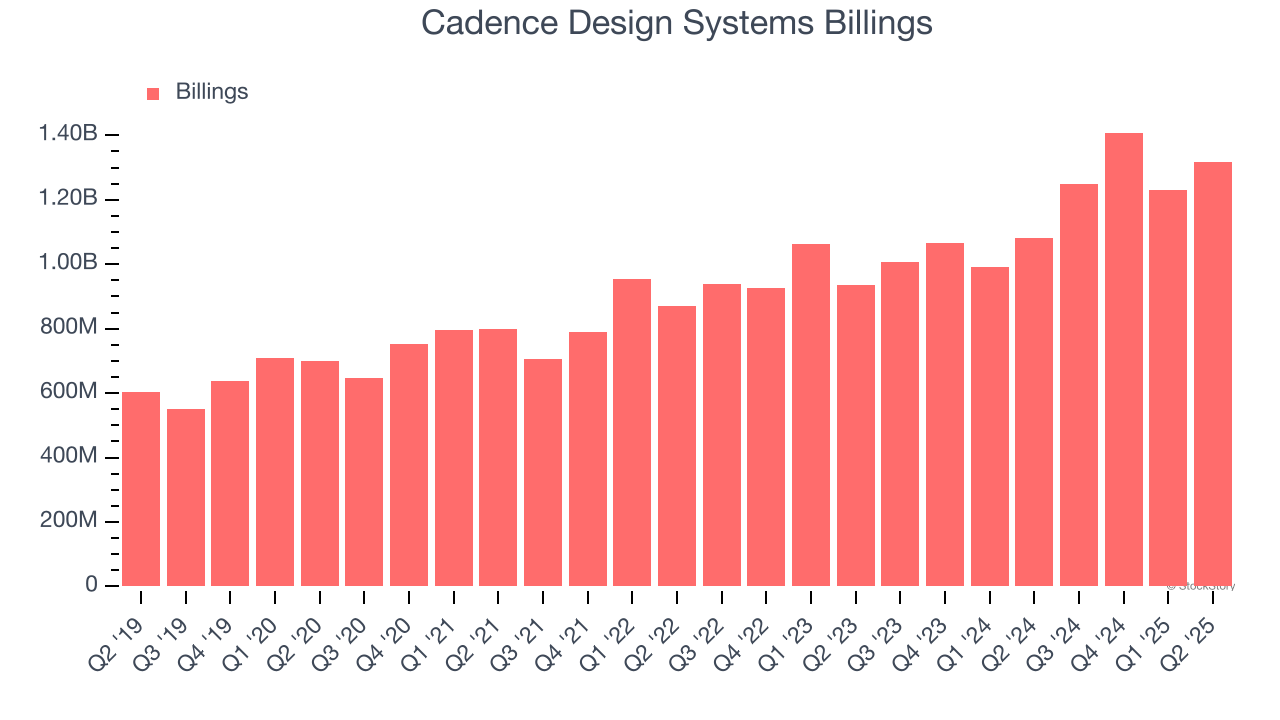
2. Customer Acquisition Costs Are Recovered in Record Time
The customer acquisition cost (CAC) payback period represents the months required to recover the cost of acquiring a new customer. Essentially, it’s the break-even point for sales and marketing investments. A shorter CAC payback period is ideal, as it implies better returns on investment and business scalability.
Cadence Design Systems is extremely efficient at acquiring new customers, and its CAC payback period checked in at 6.1 months this quarter. The company’s rapid recovery of its customer acquisition costs indicates it has a highly differentiated product offering and a strong brand reputation. These dynamics give Cadence Design Systems more resources to pursue new product initiatives while maintaining the flexibility to increase its sales and marketing investments.
One Reason to be Careful:
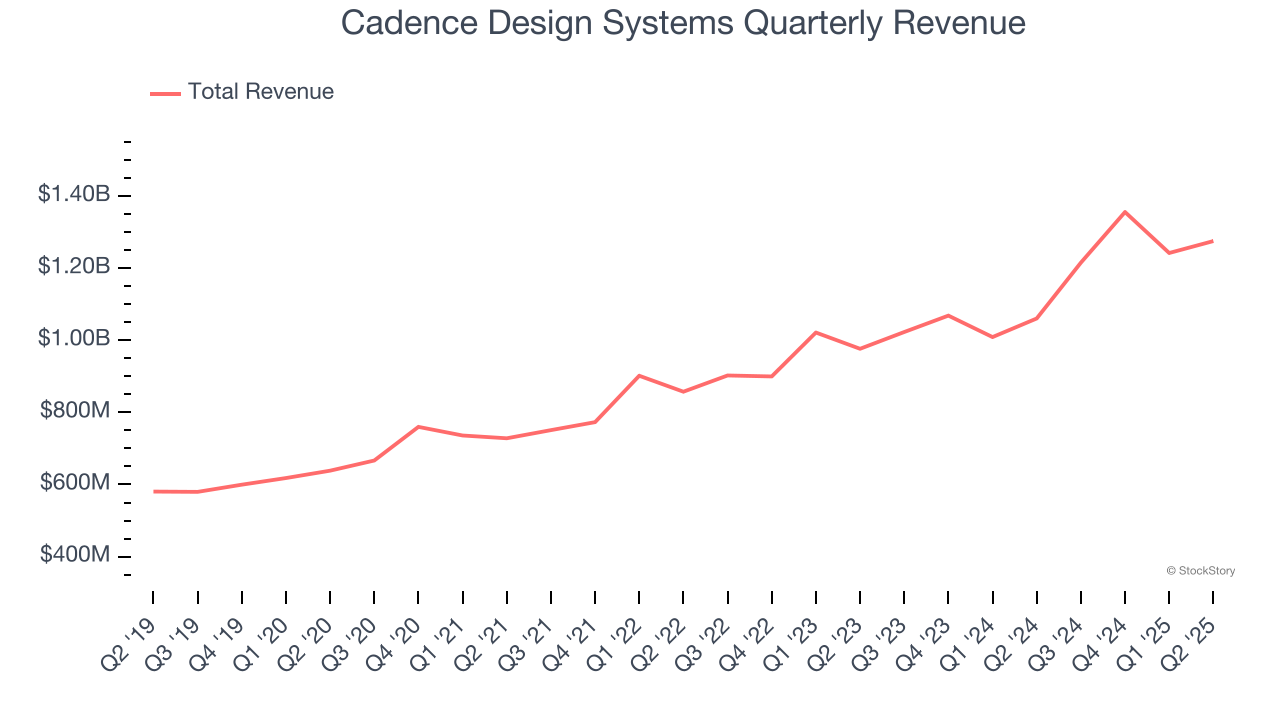
Long-Term Revenue Growth Disappoints
A company’s long-term sales performance is one signal of its overall quality. Even a bad business can shine for one or two quarters, but a top-tier one grows for years. Over the last five years, Cadence Design Systems grew its sales at a 15.9% annual rate. Although this growth is acceptable on an absolute basis, it fell slightly short of our standards for the software sector, which enjoys a number of secular tailwinds. Luckily, there are other things to like about Cadence Design Systems.
Final Judgment
Cadence Design Systems’s merits more than compensate for its flaws, and with its shares beating the market recently, the stock trades at 17.2× forward price-to-sales (or $348.24 per share). Is now the right time to buy? See for yourself in our in-depth research report, it’s free.
Stocks We Like Even More Than Cadence Design Systems
Donald Trump’s April 2025 "Liberation Day" tariffs sent markets into a tailspin, but stocks have since rebounded strongly, proving that knee-jerk reactions often create the best buying opportunities.
The smart money is already positioning for the next leg up. Don’t miss out on the recovery - check out our Top 9 Market-Beating Stocks. This is a curated list of our High Quality stocks that have generated a market-beating return of 183% over the last five years (as of March 31st 2025).
Stocks that made our list in 2020 include now familiar names such as Nvidia (+1,545% between March 2020 and March 2025) as well as under-the-radar businesses like the once-small-cap company Comfort Systems (+782% five-year return). Find your next big winner with StockStory today.
StockStory is growing and hiring equity analyst and marketing roles. Are you a 0 to 1 builder passionate about the markets and AI? See the open roles here.