
Pathward Financial currently trades at $74.89 per share and has shown little upside over the past six months, posting a middling return of 2.7%. The stock also fell short of the S&P 500’s 18.6% gain during that period.
Does this present a buying opportunity for CASH? Or is its underperformance reflective of its story and business quality? Find out in our full research report, it’s free.
Why Is Pathward Financial a Good Business?
Formerly known as Meta Financial until its 2022 rebranding, Pathward Financial (NASDAQ: CASH) provides banking-as-a-service solutions and commercial finance products, enabling partners to offer financial services like prepaid cards, payment processing, and lending options.
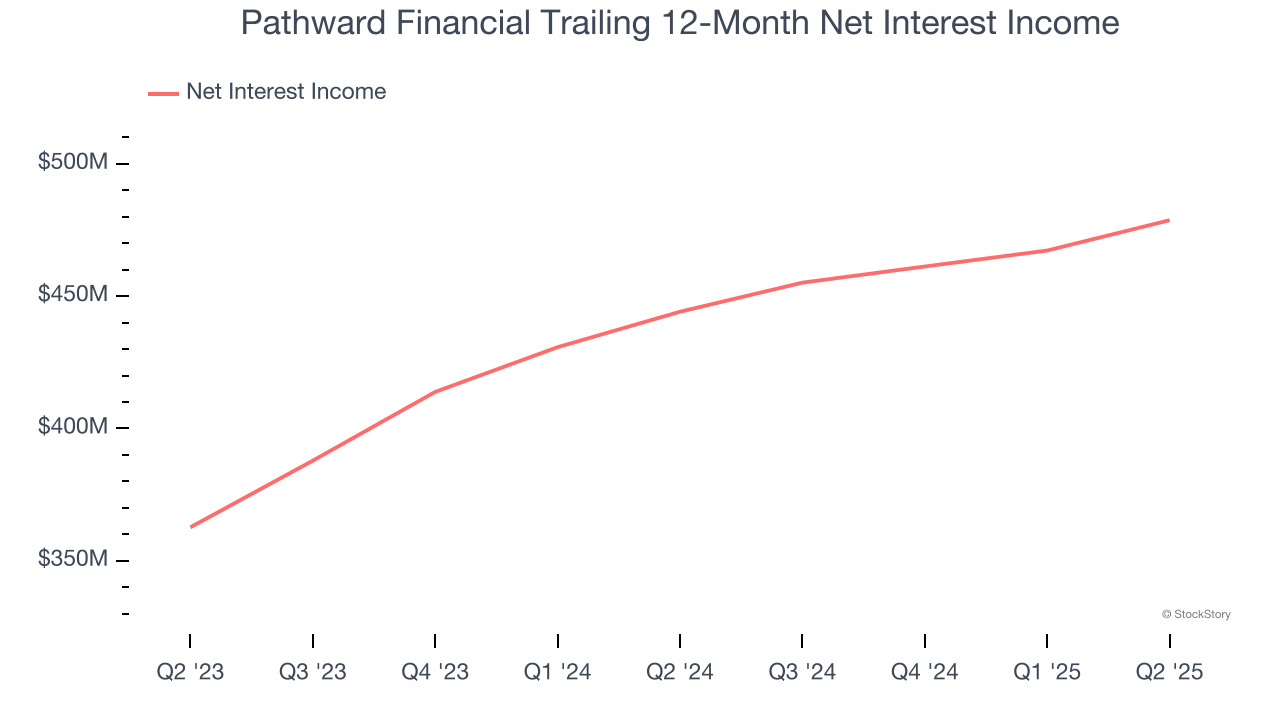
1. Net Interest Income Skyrockets, Fueling Growth Opportunities
Our experience and research show the market cares primarily about a bank’s net interest income growth as one-time fees are considered a lower-quality and non-recurring revenue source.
Pathward Financial’s net interest income has grown at a 13.7% annualized rate over the last five years, better than the broader banking industry and faster than its total revenue.
2. Elite Net Interest Margin Powers Best-In-Class Loan Book
Net interest margin (NIM) represents the unit economics of a bank by measuring the profitability of its interest-bearing assets relative to its interest-bearing liabilities. It's a fundamental metric that investors use to assess lending premiums and returns.
Over the past two years, we can see that Pathward Financial’s net interest margin averaged an elite 6.6%, indicating the company has a high-yielding loan book and a low cost of funds.

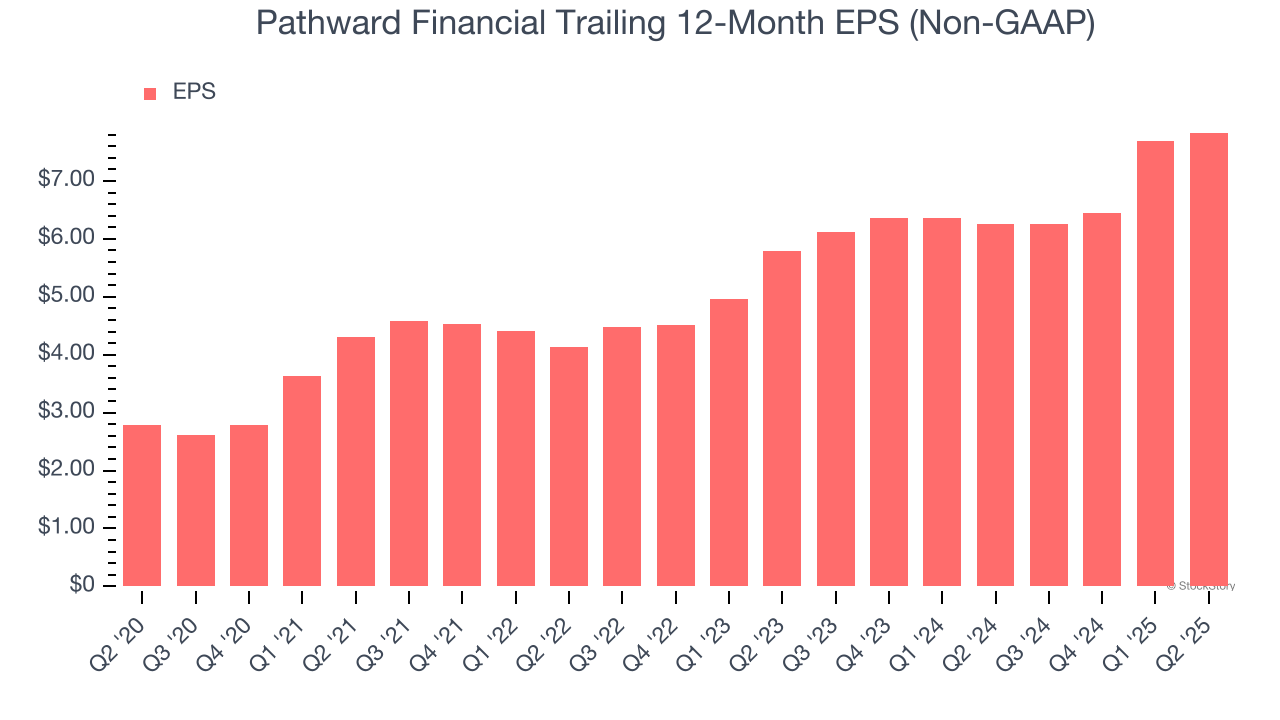
3. Outstanding Long-Term EPS Growth
We track the long-term change in earnings per share (EPS) because it highlights whether a company’s growth is profitable.
Pathward Financial’s EPS grew at an astounding 22.9% compounded annual growth rate over the last five years, higher than its 11.2% annualized revenue growth. This tells us the company became more profitable on a per-share basis as it expanded.
Final Judgment
These are just a few reasons why Pathward Financial is a cream-of-the-crop banking company. With its shares trailing the market in recent months, the stock trades at 2× forward P/B (or $74.89 per share). Is now a good time to initiate a position? See for yourself in our full research report, it’s free.
Stocks We Like Even More Than Pathward Financial
Trump’s April 2025 tariff bombshell triggered a massive market selloff, but stocks have since staged an impressive recovery, leaving those who panic sold on the sidelines.
Take advantage of the rebound by checking out our Top 5 Growth Stocks for this month. This is a curated list of our High Quality stocks that have generated a market-beating return of 183% over the last five years (as of March 31st 2025).
Stocks that made our list in 2020 include now familiar names such as Nvidia (+1,545% between March 2020 and March 2025) as well as under-the-radar businesses like the once-small-cap company Comfort Systems (+782% five-year return). Find your next big winner with StockStory today.
StockStory is growing and hiring equity analyst and marketing roles. Are you a 0 to 1 builder passionate about the markets and AI? See the open roles here.