Over the past six months, ESAB’s shares (currently trading at $109.61) have posted a disappointing 5.9% loss, well below the S&P 500’s 18.6% gain. This might have investors contemplating their next move.
Is there a buying opportunity in ESAB, or does it present a risk to your portfolio? Check out our in-depth research report to see what our analysts have to say, it’s free.
Why Do We Think ESAB Will Underperform?
Even though the stock has become cheaper, we're sitting this one out for now. Here are three reasons we avoid ESAB and a stock we'd rather own.
1. Slow Organic Growth Suggests Waning Demand In Core Business
Investors interested in Professional Tools and Equipment companies should track organic revenue in addition to reported revenue. This metric gives visibility into ESAB’s core business because it excludes one-time events such as mergers, acquisitions, and divestitures along with foreign currency fluctuations - non-fundamental factors that can manipulate the income statement.
Over the last two years, ESAB’s organic revenue averaged 1.7% year-on-year growth. This performance was underwhelming and suggests it may need to improve its products, pricing, or go-to-market strategy, which can add an extra layer of complexity to its operations. 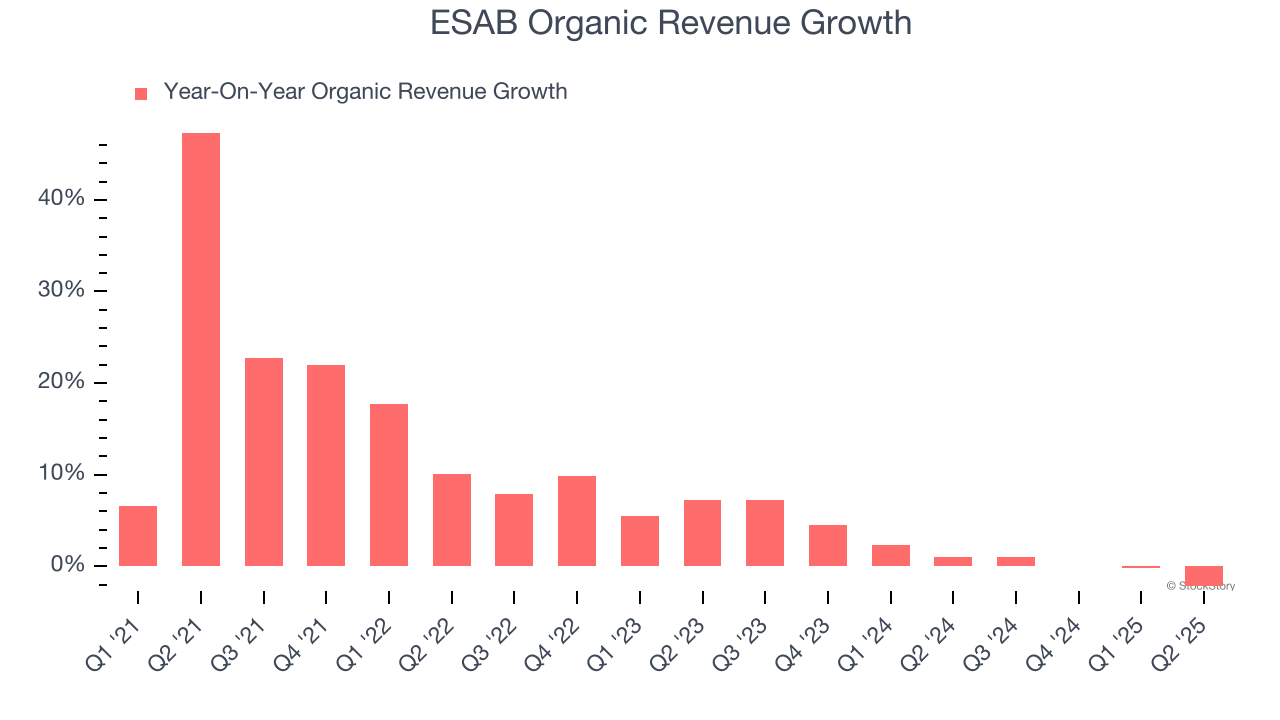
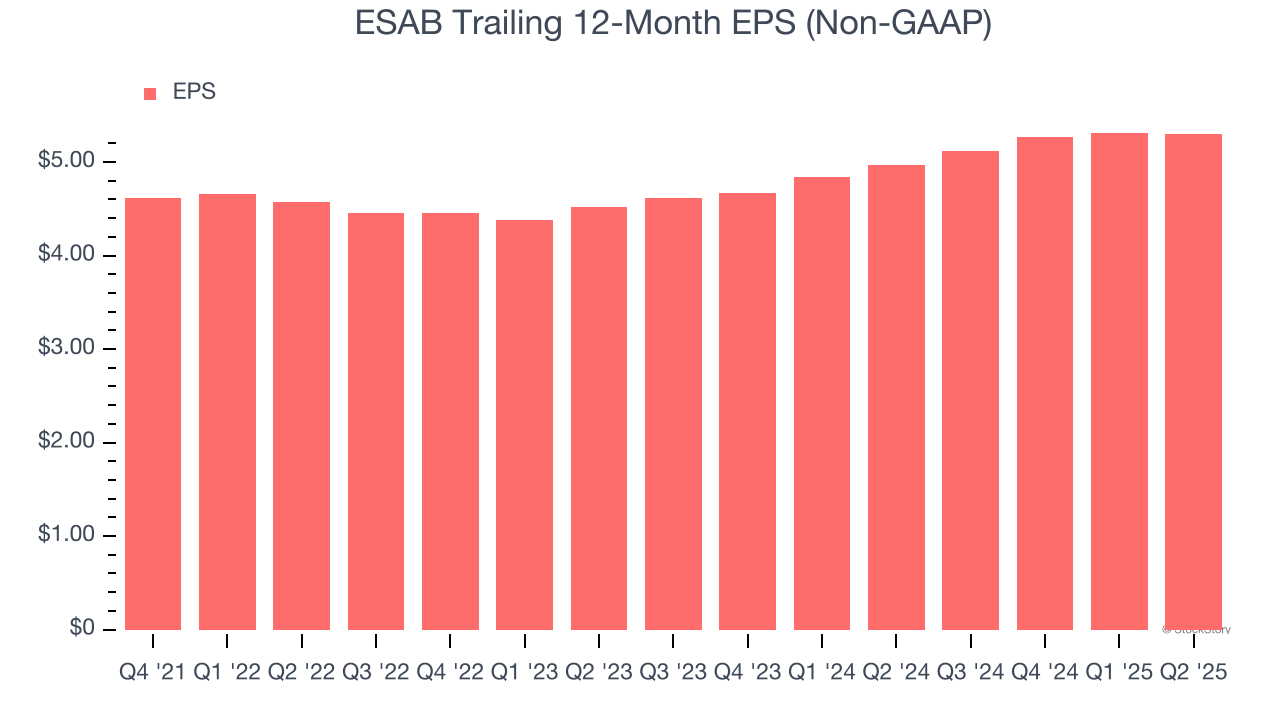
2. EPS Barely Growing
Analyzing the long-term change in earnings per share (EPS) shows whether a company's incremental sales were profitable – for example, revenue could be inflated through excessive spending on advertising and promotions.
ESAB’s weak 3.6% annual EPS growth over the last four years aligns with its revenue performance. On the bright side, this tells us its incremental sales were profitable.
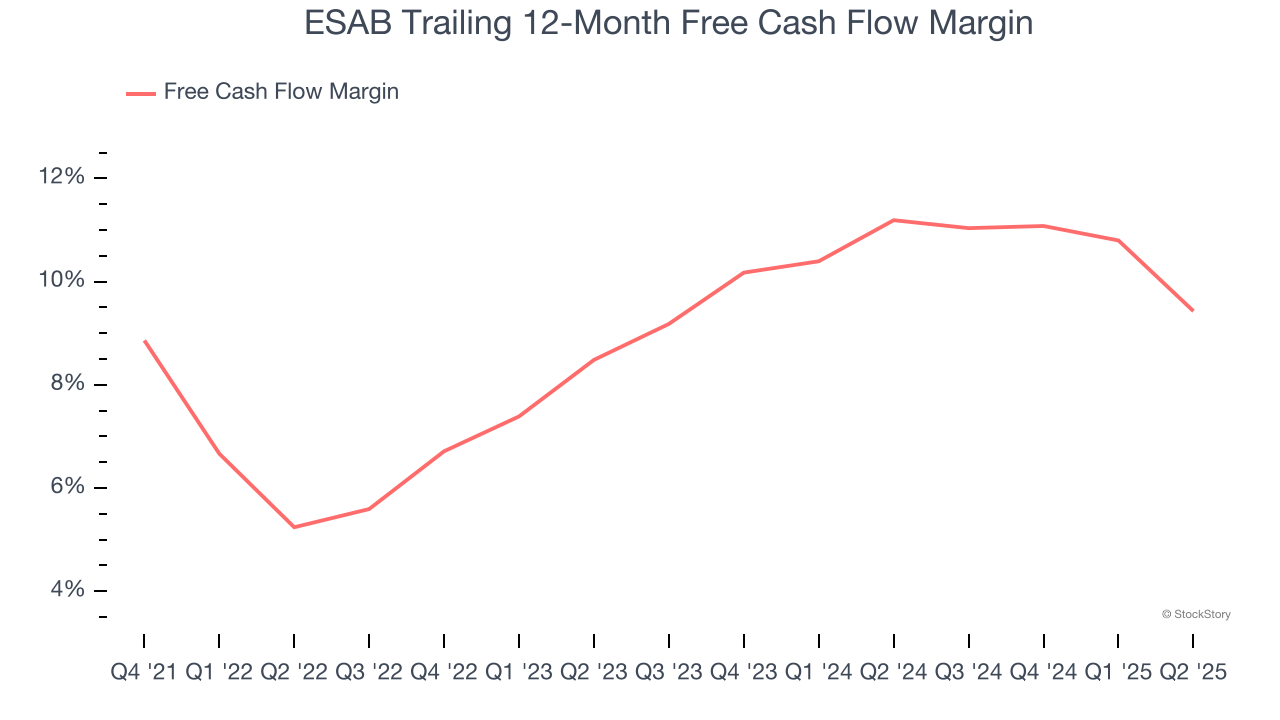
3. Free Cash Flow Margin Dropping
If you’ve followed StockStory for a while, you know we emphasize free cash flow. Why, you ask? We believe that in the end, cash is king, and you can’t use accounting profits to pay the bills.
As you can see below, ESAB’s margin dropped by 4.6 percentage points over the last five years. If its declines continue, it could signal increasing investment needs and capital intensity. ESAB’s free cash flow margin for the trailing 12 months was 9.4%.
Final Judgment
ESAB doesn’t pass our quality test. After the recent drawdown, the stock trades at 18.9× forward P/E (or $109.61 per share). While this valuation is fair, the upside isn’t great compared to the potential downside. There are more exciting stocks to buy at the moment. We’d recommend looking at the Amazon and PayPal of Latin America.
Stocks We Would Buy Instead of ESAB
When Trump unveiled his aggressive tariff plan in April 2025, markets tanked as investors feared a full-blown trade war. But those who panicked and sold missed the subsequent rebound that’s already erased most losses.
Don’t let fear keep you from great opportunities and take a look at Top 5 Strong Momentum Stocks for this week. This is a curated list of our High Quality stocks that have generated a market-beating return of 183% over the last five years (as of March 31st 2025).
Stocks that made our list in 2020 include now familiar names such as Nvidia (+1,545% between March 2020 and March 2025) as well as under-the-radar businesses like the once-small-cap company Exlservice (+354% five-year return). Find your next big winner with StockStory today.
StockStory is growing and hiring equity analyst and marketing roles. Are you a 0 to 1 builder passionate about the markets and AI? See the open roles here.


