
While the S&P 500 is up 18.6% since March 2025, Hartford (currently trading at $132.50 per share) has lagged behind, posting a return of 7.1%. This might have investors contemplating their next move.
Is there a buying opportunity in Hartford, or does it present a risk to your portfolio? Get the full breakdown from our expert analysts, it’s free.
Why Is Hartford Not Exciting?
We're cautious about Hartford. Here are three reasons there are better opportunities than HIG and a stock we'd rather own.
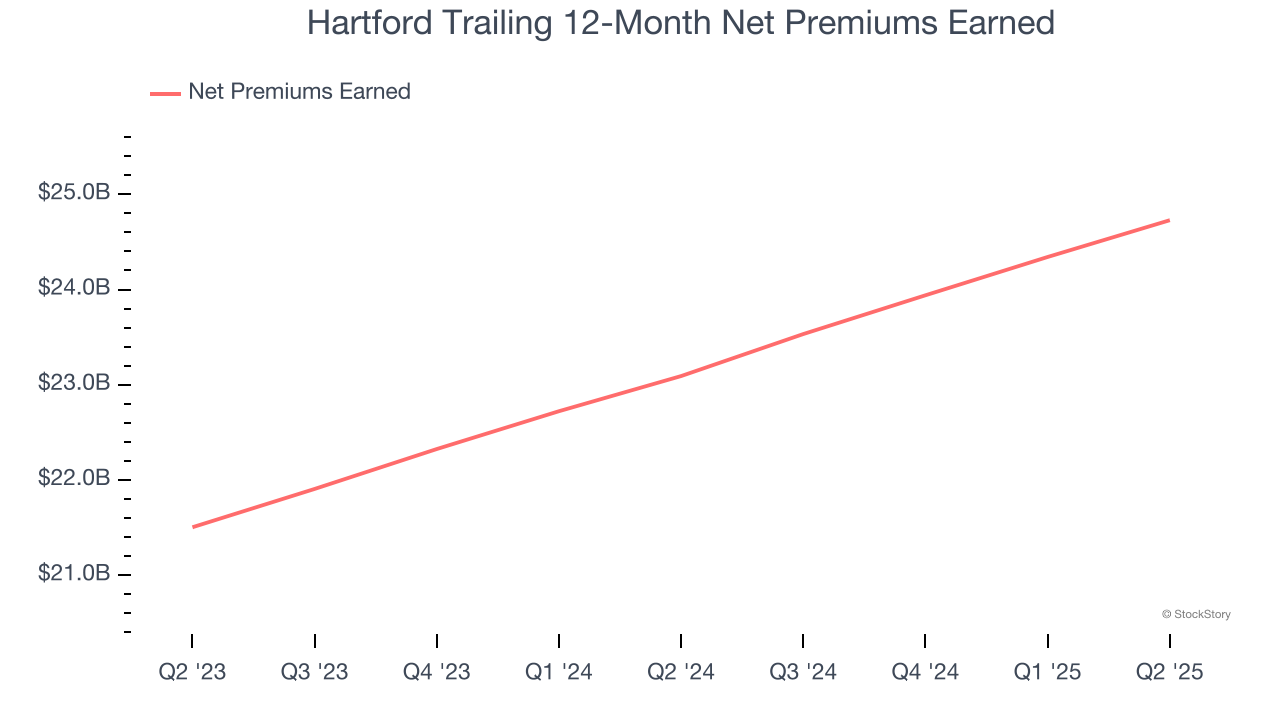
1. Net Premiums Earned Point to Soft Demand
When insurers sell policies, they protect themselves from extremely large losses or an outsized accumulation of losses with reinsurance (insurance for insurance companies). Net premiums earned are:
- Gross premiums - what’s ceded to reinsurers as a risk mitigation and transfer strategy
Hartford’s net premiums earned has grown at a 6.2% annualized rate over the last five years, slightly worse than the broader insurance industry and in line with its total revenue.
2. Revenue Projections Show Stormy Skies Ahead
Forecasted revenues by Wall Street analysts signal a company’s potential. Predictions may not always be accurate, but accelerating growth typically boosts valuation multiples and stock prices while slowing growth does the opposite.
Over the next 12 months, sell-side analysts expect Hartford’s revenue to drop by 15%, a decrease from its 7.9% annualized growth for the past two years. This projection is underwhelming and implies its products and services will face some demand challenges.
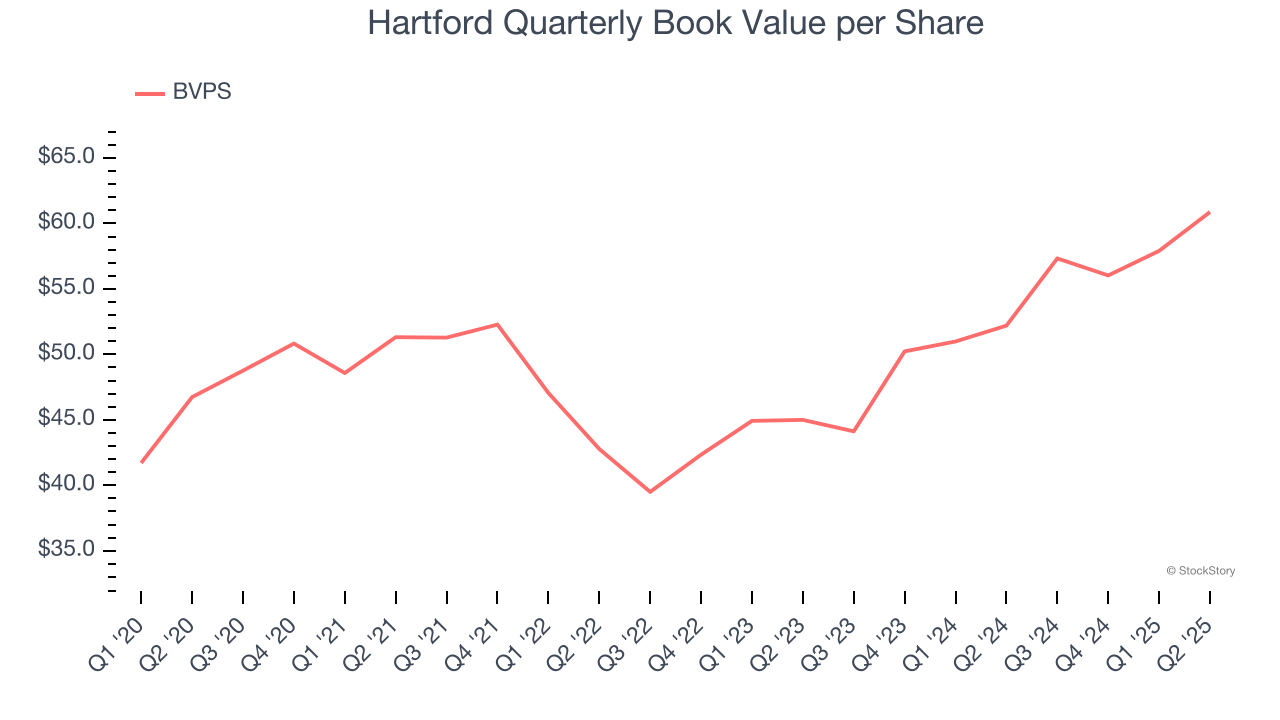
3. Steady Increase in BVPS Highlights Solid Asset Growth
We consider book value per share (BVPS) a critical metric for insurance companies. BVPS represents the total net worth per share, providing insight into a company’s financial strength and ability to meet policyholder obligations.
Although Hartford’s BVPS increased by a meager 5.4% annually over the last five years, the good news is that its growth has recently accelerated as BVPS grew at a solid 16.3% annual clip over the past two years (from $45.00 to $60.88 per share).
Final Judgment
Hartford isn’t a terrible business, but it doesn’t pass our bar. With its shares trailing the market in recent months, the stock trades at 2.1× forward P/B (or $132.50 per share). While this valuation is reasonable, we don’t really see a big opportunity at the moment. We're pretty confident there are superior stocks to buy right now. We’d suggest looking at one of our top software and edge computing picks.
Stocks We Would Buy Instead of Hartford
Donald Trump’s April 2025 "Liberation Day" tariffs sent markets into a tailspin, but stocks have since rebounded strongly, proving that knee-jerk reactions often create the best buying opportunities.
The smart money is already positioning for the next leg up. Don’t miss out on the recovery - check out our Top 5 Growth Stocks for this month. This is a curated list of our High Quality stocks that have generated a market-beating return of 183% over the last five years (as of March 31st 2025).
Stocks that made our list in 2020 include now familiar names such as Nvidia (+1,545% between March 2020 and March 2025) as well as under-the-radar businesses like the once-micro-cap company Kadant (+351% five-year return). Find your next big winner with StockStory today.
StockStory is growing and hiring equity analyst and marketing roles. Are you a 0 to 1 builder passionate about the markets and AI? See the open roles here.


