Human capital management company Paychex (NASDAQ: PAYX) met Wall Street’s revenue expectations in Q3 CY2025, with sales up 16.8% year on year to $1.54 billion. Its non-GAAP profit of $1.22 per share was 1.4% above analysts’ consensus estimates.
Is now the time to buy Paychex? Find out by accessing our full research report, it’s free.
Paychex (PAYX) Q3 CY2025 Highlights:
- Revenue: $1.54 billion vs analyst estimates of $1.54 billion (16.8% year-on-year growth, in line)
- Adjusted EPS: $1.22 vs analyst estimates of $1.20 (1.4% beat)
- Adjusted EBITDA: $680 million vs analyst estimates of $709.5 million (44.2% margin, 4.2% miss)
- Operating Margin: 35.2%, down from 41.5% in the same quarter last year
- Free Cash Flow Margin: 43%, up from 23.4% in the previous quarter
- Market Capitalization: $46.22 billion
"We are pleased to report a strong start to fiscal 2026, delivering robust double-digit revenue growth," stated John Gibson, President and Chief Executive Officer.
Company Overview
Once known as the go-to service for small business payroll needs, Paychex (NASDAQ: PAYX) provides payroll processing, HR services, employee benefits administration, and insurance solutions to small and medium-sized businesses.
Revenue Growth
Reviewing a company’s long-term sales performance reveals insights into its quality. Any business can put up a good quarter or two, but many enduring ones grow for years. Over the last five years, Paychex grew its sales at a sluggish 7.8% compounded annual growth rate. This was below our standard for the software sector and is a rough starting point for our analysis.
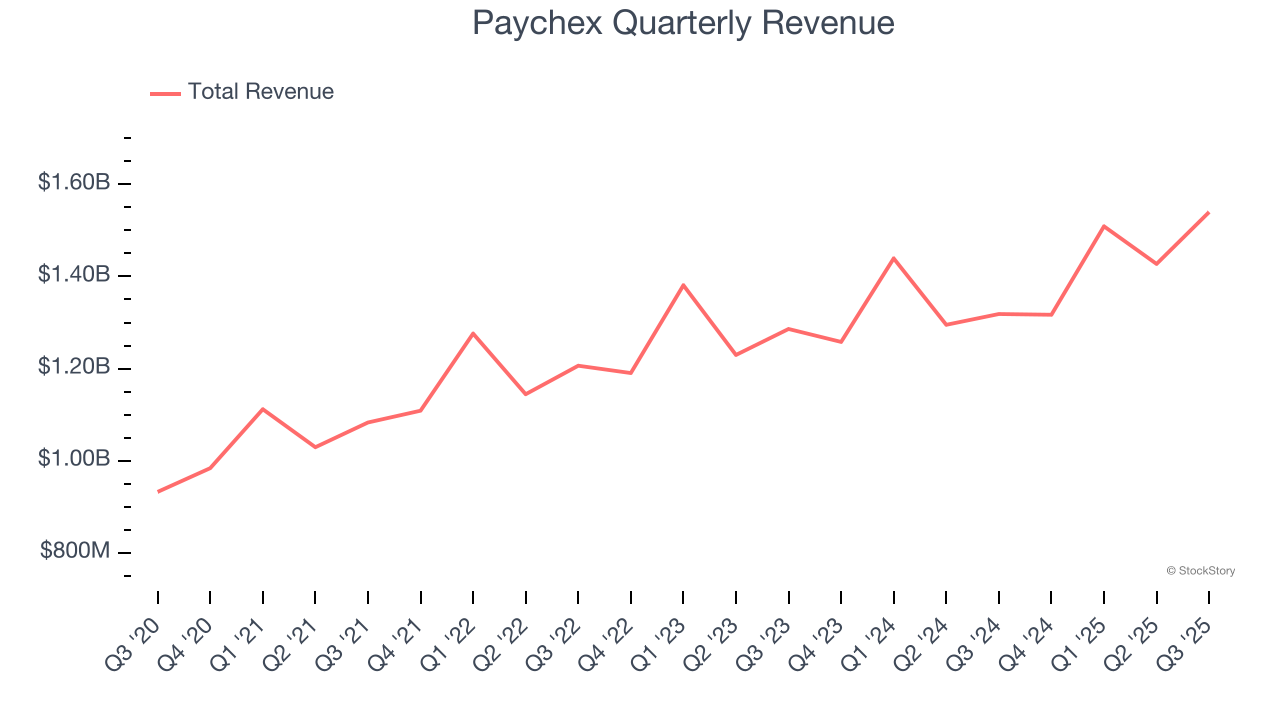
Long-term growth is the most important, but within software, a half-decade historical view may miss new innovations or demand cycles. Paychex’s recent performance shows its demand has slowed as its annualized revenue growth of 6.7% over the last two years was below its five-year trend. 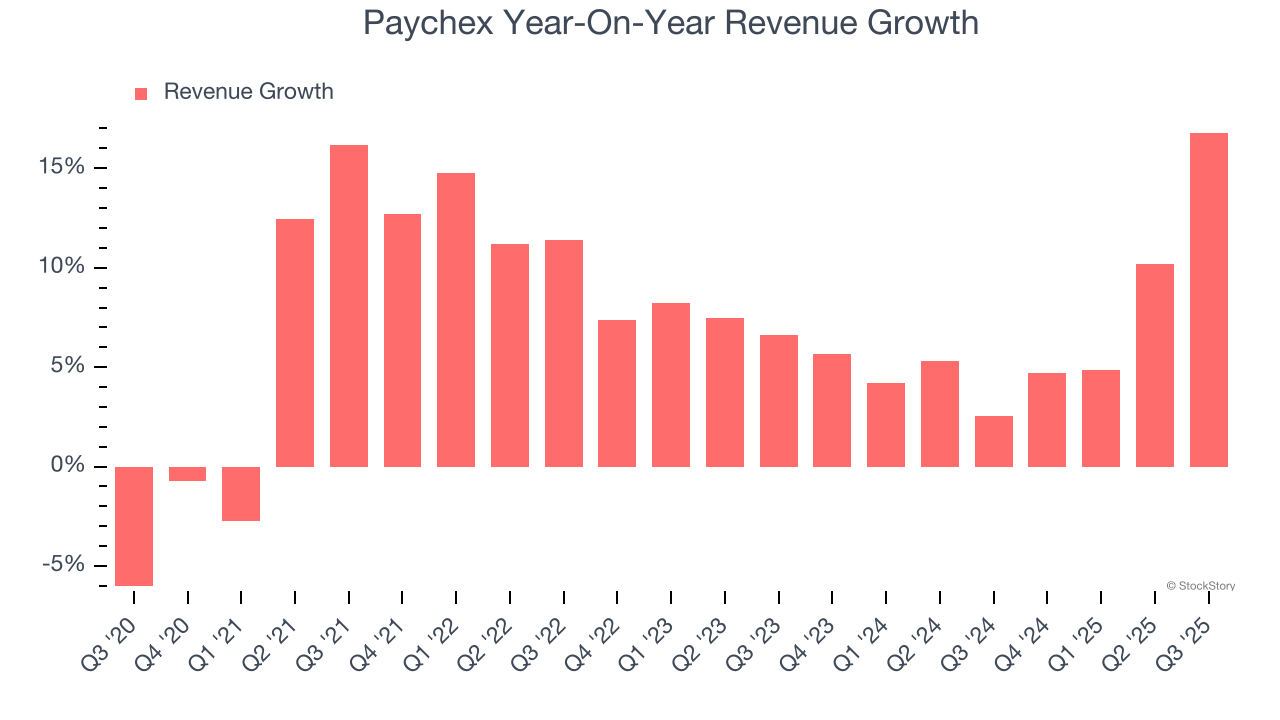
This quarter, Paychex’s year-on-year revenue growth was 16.8%, and its $1.54 billion of revenue was in line with Wall Street’s estimates.
Looking ahead, sell-side analysts expect revenue to grow 14.4% over the next 12 months. Although this projection indicates its newer products and services will spur better top-line performance, it is still below the sector average.
Today’s young investors won’t have read the timeless lessons in Gorilla Game: Picking Winners In High Technology because it was written more than 20 years ago when Microsoft and Apple were first establishing their supremacy. But if we apply the same principles, then enterprise software stocks leveraging their own generative AI capabilities may well be the Gorillas of the future. So, in that spirit, we are excited to present our Special Free Report on a profitable, fast-growing enterprise software stock that is already riding the automation wave and looking to catch the generative AI next.
Customer Acquisition Efficiency
The customer acquisition cost (CAC) payback period measures the months a company needs to recoup the money spent on acquiring a new customer. This metric helps assess how quickly a business can break even on its sales and marketing investments.
Paychex is extremely efficient at acquiring new customers, and its CAC payback period checked in at 21.9 months this quarter. The company’s rapid recovery of its customer acquisition costs means it can attempt to spur growth by increasing its sales and marketing investments. 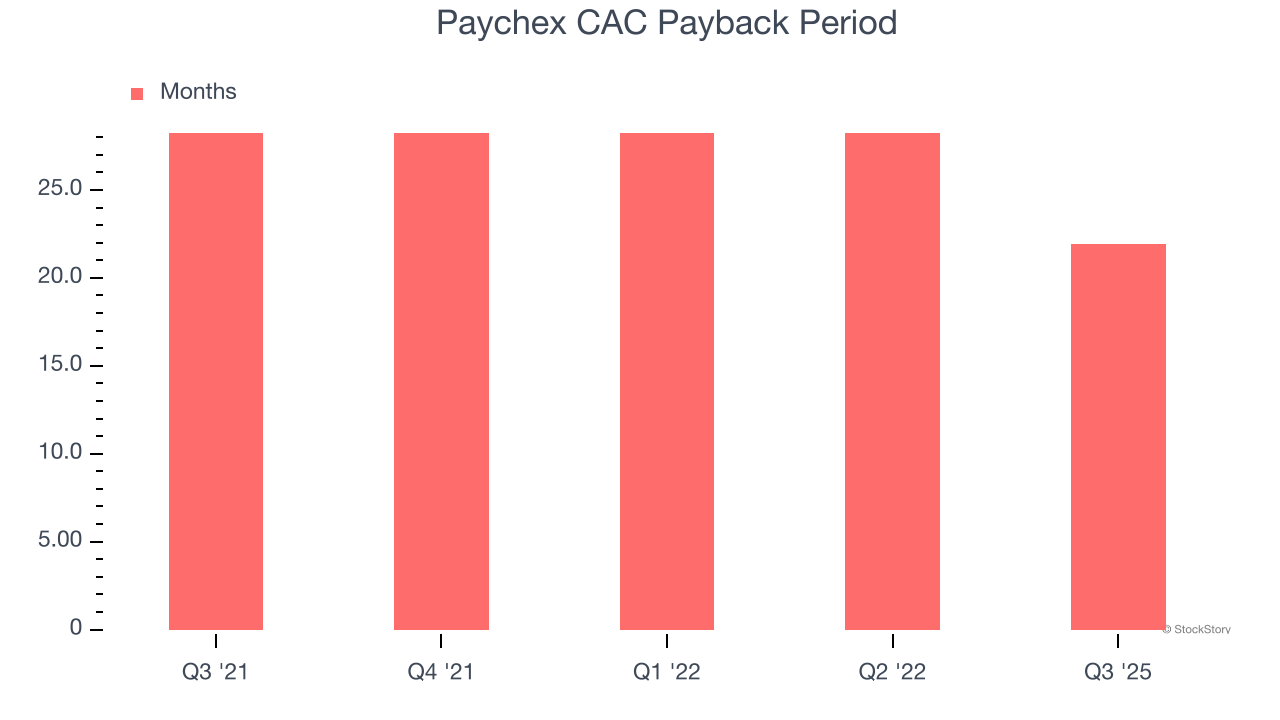
Key Takeaways from Paychex’s Q3 Results
We struggled to find many positives in these results. Sales were roughly in line while earnings came in slightly ahead of expectations. Overall, this was a softer quarter. The stock traded down 7.5% to $118.92 immediately following the results.
Paychex didn’t show it’s best hand this quarter, but does that create an opportunity to buy the stock right now? We think that the latest quarter is only one piece of the longer-term business quality puzzle. Quality, when combined with valuation, can help determine if the stock is a buy. We cover that in our actionable full research report which you can read here, it’s free.