
American Airlines has been treading water for the past six months, recording a small return of 0.9% while holding steady at $13.47. The stock also fell short of the S&P 500’s 11.6% gain during that period.
Is now the time to buy American Airlines, or should you be careful about including it in your portfolio? Get the full stock story straight from our expert analysts, it’s free.
Why Do We Think American Airlines Will Underperform?
We're swiping left on American Airlines for now. Here are three reasons there are better opportunities than AAL and a stock we'd rather own.
1. Weak Growth in Revenue Passenger Miles Points to Soft Demand
Revenue growth can be broken down into changes in price and volume (for companies like American Airlines, our preferred volume metric is revenue passenger miles). While both are important, the latter is the most critical to analyze because prices have a ceiling.
American Airlines’s revenue passenger miles came in at 65.76 billion in the latest quarter, and over the last two years, averaged 4.9% year-on-year growth. This performance was underwhelming and suggests it might have to lower prices or invest in product improvements to accelerate growth, factors that can hinder near-term profitability. 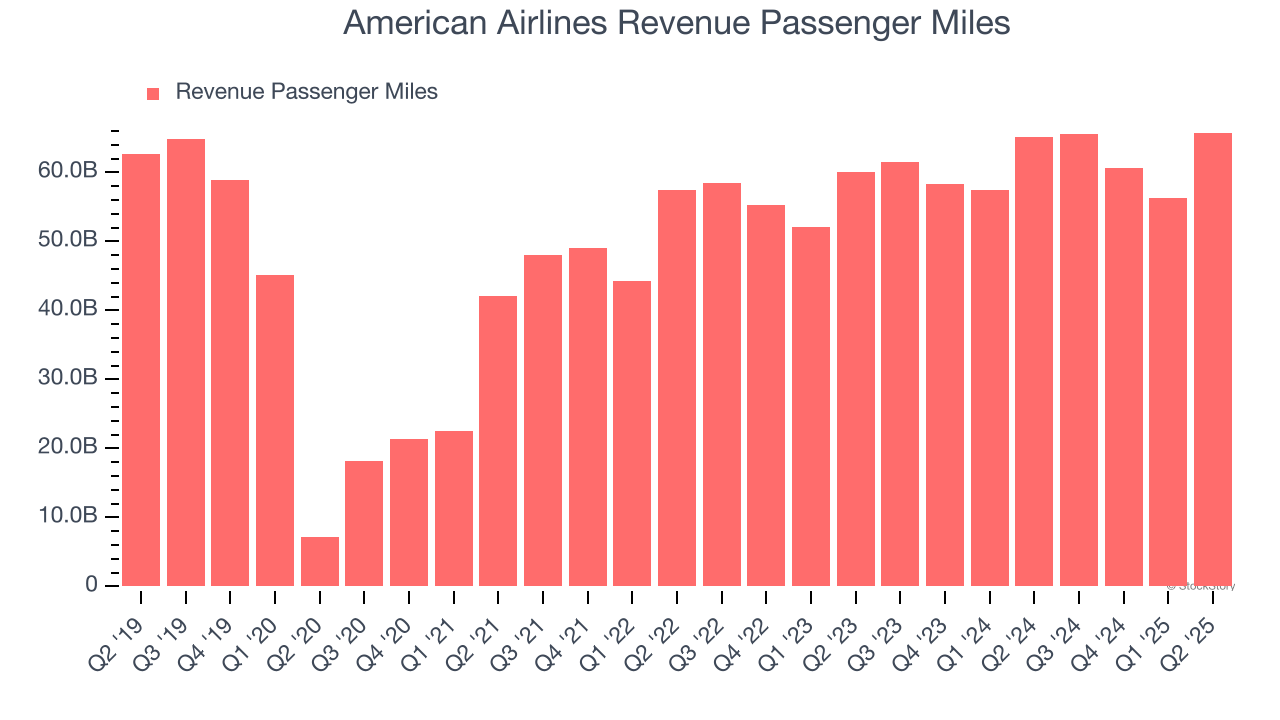
2. Previous Growth Initiatives Haven’t Impressed
Growth gives us insight into a company’s long-term potential, but how capital-efficient was that growth? A company’s ROIC explains this by showing how much operating profit it makes compared to the money it has raised (debt and equity).
American Airlines historically did a mediocre job investing in profitable growth initiatives. Its five-year average ROIC was 3.3%, lower than the typical cost of capital (how much it costs to raise money) for consumer discretionary companies.
3. High Debt Levels Increase Risk
As long-term investors, the risk we care about most is the permanent loss of capital, which can happen when a company goes bankrupt or raises money from a disadvantaged position. This is separate from short-term stock price volatility, something we are much less bothered by.
American Airlines’s $37.2 billion of debt exceeds the $8.57 billion of cash on its balance sheet. Furthermore, its 6× net-debt-to-EBITDA ratio (based on its EBITDA of $4.70 billion over the last 12 months) shows the company is overleveraged.
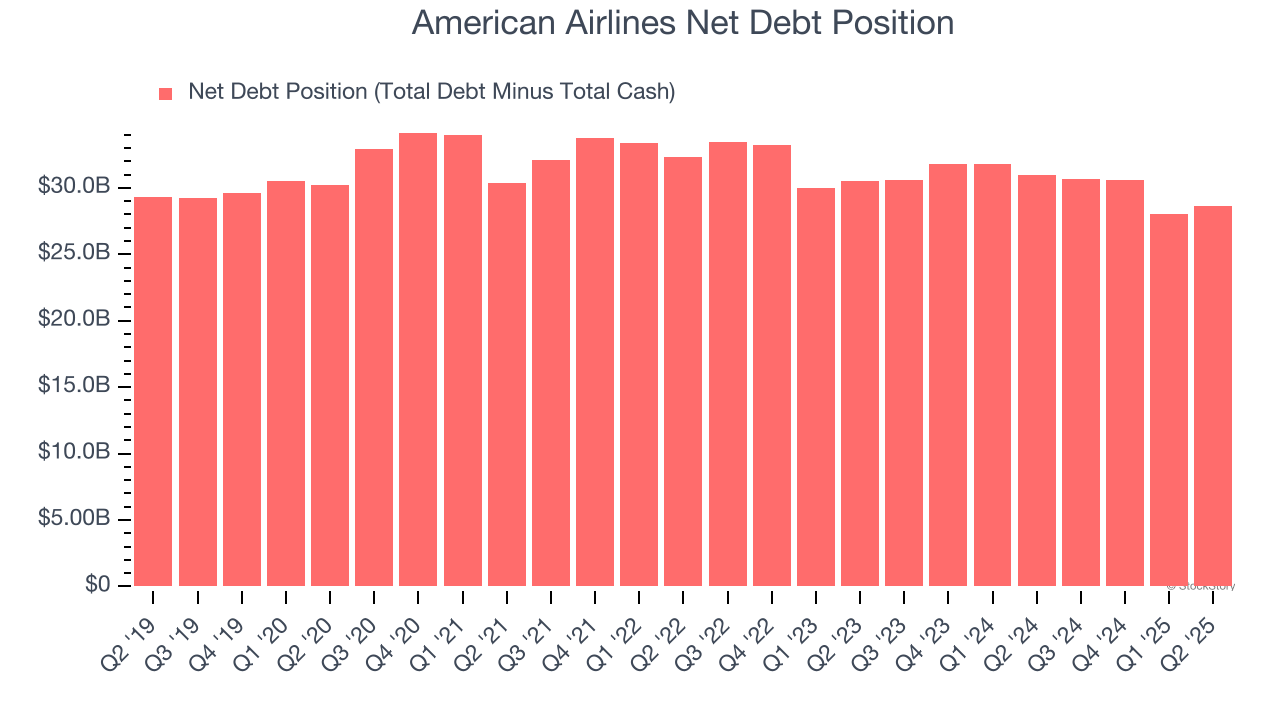
At this level of debt, incremental borrowing becomes increasingly expensive and credit agencies could downgrade the company’s rating if profitability falls. American Airlines could also be backed into a corner if the market turns unexpectedly – a situation we seek to avoid as investors in high-quality companies.
We hope American Airlines can improve its balance sheet and remain cautious until it increases its profitability or pays down its debt.
Final Judgment
We see the value of companies helping consumers, but in the case of American Airlines, we’re out. With its shares trailing the market in recent months, the stock trades at 9× forward P/E (or $13.47 per share). While this valuation is optically cheap, the potential downside is huge given its shaky fundamentals. There are better stocks to buy right now. We’d recommend looking at the most dominant software business in the world.
Stocks We Like More Than American Airlines
Trump’s April 2025 tariff bombshell triggered a massive market selloff, but stocks have since staged an impressive recovery, leaving those who panic sold on the sidelines.
Take advantage of the rebound by checking out our Top 9 Market-Beating Stocks. This is a curated list of our High Quality stocks that have generated a market-beating return of 183% over the last five years (as of March 31st 2025).
Stocks that made our list in 2020 include now familiar names such as Nvidia (+1,545% between March 2020 and March 2025) as well as under-the-radar businesses like the once-micro-cap company Tecnoglass (+1,754% five-year return). Find your next big winner with StockStory today.
StockStory is growing and hiring equity analyst and marketing roles. Are you a 0 to 1 builder passionate about the markets and AI? See the open roles here.


