
Footwear company Caleres (NYSE: CAL) met Wall Street’s revenue expectations in Q2 CY2025, but sales fell by 3.6% year on year to $658.5 million. Its non-GAAP profit of $0.35 per share was 37.5% below analysts’ consensus estimates.
Is now the time to buy Caleres? Find out by accessing our full research report, it’s free.
Caleres (CAL) Q2 CY2025 Highlights:
- Revenue: $658.5 million vs analyst estimates of $656.5 million (3.6% year-on-year decline, in line)
- Adjusted EPS: $0.35 vs analyst expectations of $0.56 (37.5% miss)
- Adjusted EBITDA: $32.06 million vs analyst estimates of $44.85 million (4.9% margin, 28.5% miss)
- Operating Margin: 1.4%, down from 6.3% in the same quarter last year
- Free Cash Flow Margin: 5.1%, down from 10% in the same quarter last year
- Market Capitalization: $505.3 million
“While we did experience headwinds due to market uncertainty, we demonstrated the strength and resilience of our company this quarter. Sales trends improved sequentially in both segments of our business and we saw market share gains in women’s fashion footwear and in shoe chains. We experienced strength in Lead Brands, our Brand Portfolio direct-to-consumer channels, and international. We also saw significant improvement in sales trends at Famous Footwear in July and continuing through August,” said Jay Schmidt, President and Chief Executive Officer.
Company Overview
The owner of Dr. Scholl's, Caleres (NYSE: CAL) is a footwear company offering a range of styles.
Revenue Growth
A company’s long-term sales performance can indicate its overall quality. Any business can put up a good quarter or two, but many enduring ones grow for years. Over the last five years, Caleres grew its sales at a weak 2.1% compounded annual growth rate. This was below our standards and is a tough starting point for our analysis.
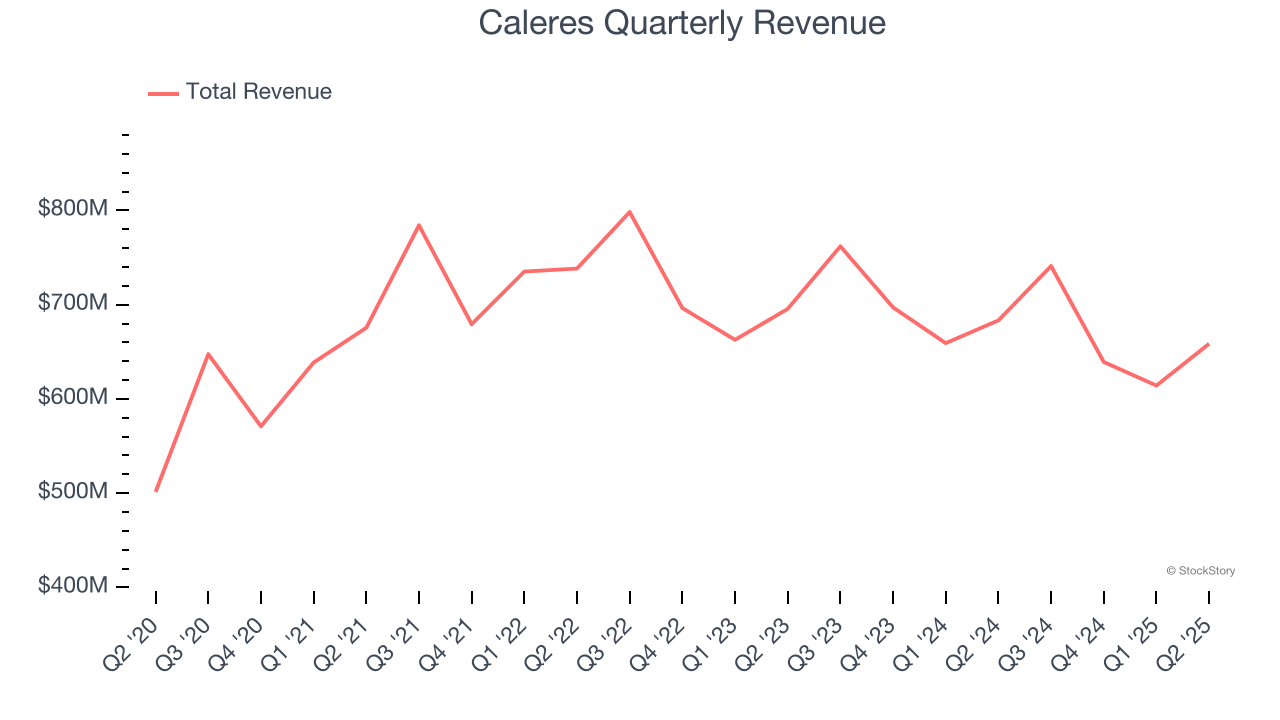
Long-term growth is the most important, but within consumer discretionary, product cycles are short and revenue can be hit-driven due to rapidly changing trends and consumer preferences. Caleres’s performance shows it grew in the past but relinquished its gains over the last two years, as its revenue fell by 3.6% annually. 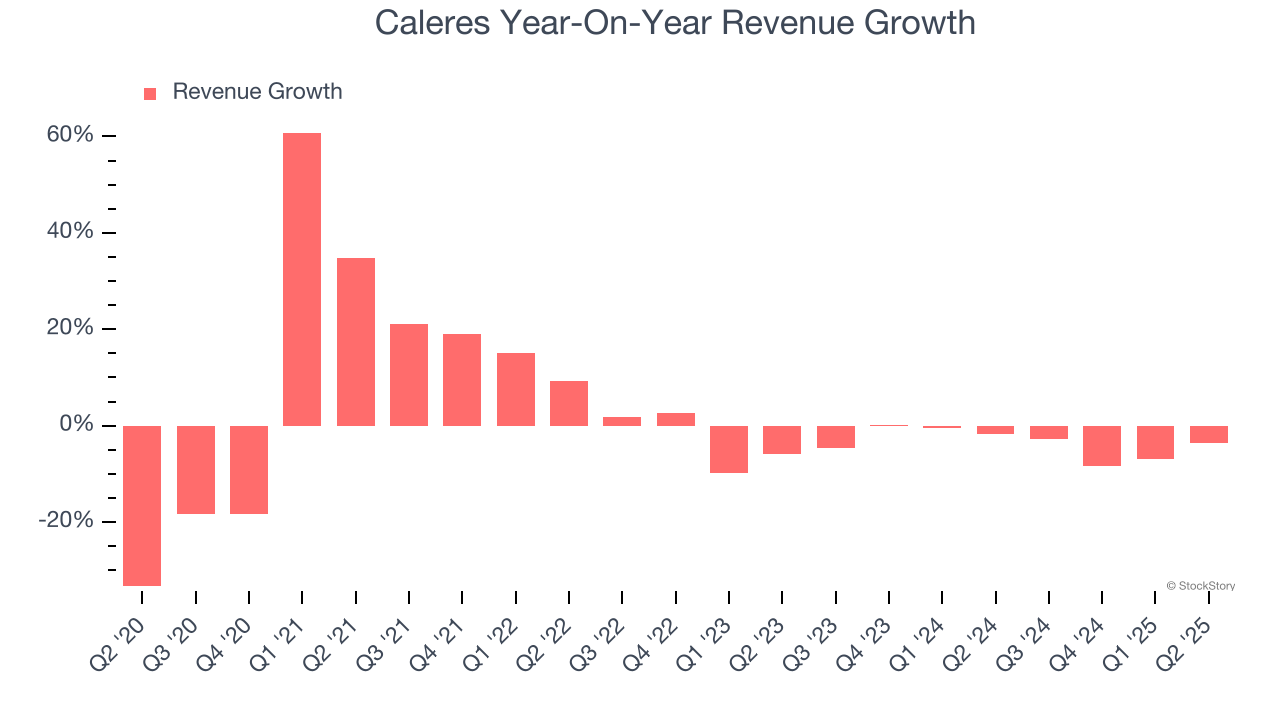
This quarter, Caleres reported a rather uninspiring 3.6% year-on-year revenue decline to $658.5 million of revenue, in line with Wall Street’s estimates.
Looking ahead, sell-side analysts expect revenue to grow 1.4% over the next 12 months. Although this projection indicates its newer products and services will catalyze better top-line performance, it is still below the sector average.
Unless you’ve been living under a rock, it should be obvious by now that generative AI is going to have a huge impact on how large corporations do business. While Nvidia and AMD are trading close to all-time highs, we prefer a lesser-known (but still profitable) stock benefiting from the rise of AI. Click here to access our free report one of our favorites growth stories.
Operating Margin
Operating margin is a key measure of profitability. Think of it as net income - the bottom line - excluding the impact of taxes and interest on debt, which are less connected to business fundamentals.
Caleres’s operating margin has shrunk over the last 12 months and averaged 5.1% over the last two years. The company’s profitability was mediocre for a consumer discretionary business and shows it couldn’t pass its higher operating expenses onto its customers.
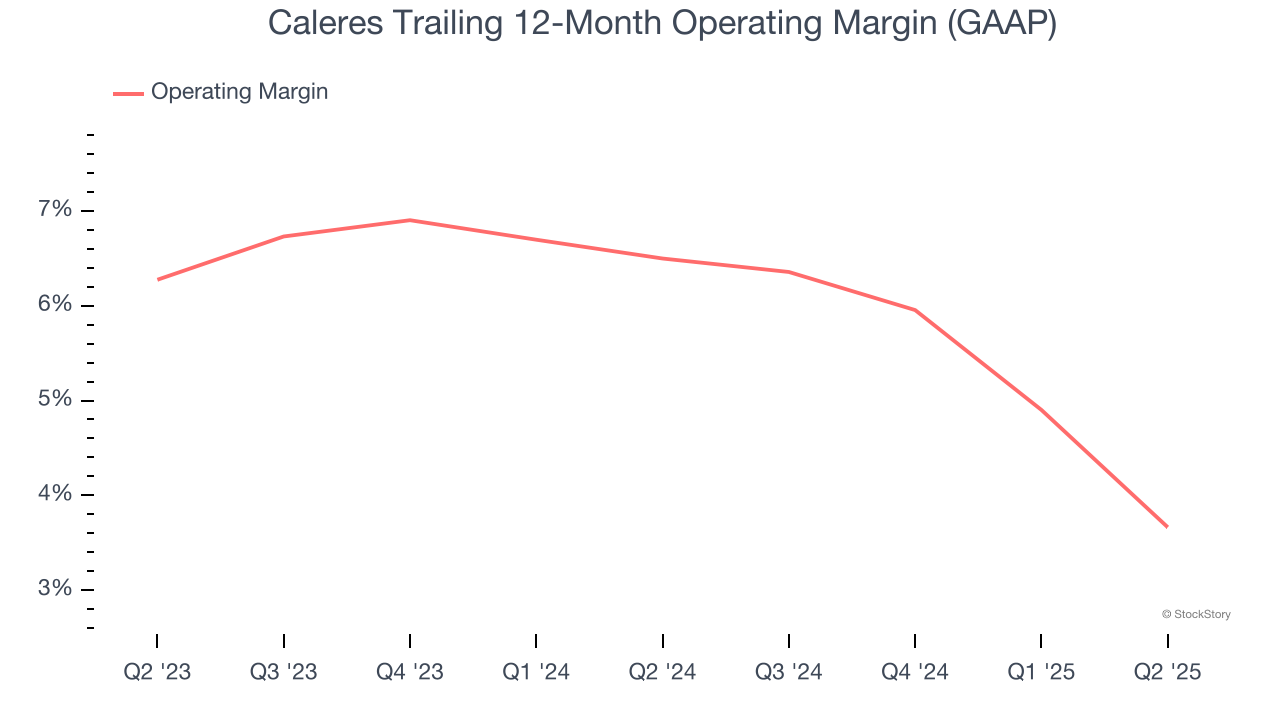
This quarter, Caleres generated an operating margin profit margin of 1.4%, down 4.9 percentage points year on year. This contraction shows it was less efficient because its expenses increased relative to its revenue.
Earnings Per Share
Revenue trends explain a company’s historical growth, but the long-term change in earnings per share (EPS) points to the profitability of that growth – for example, a company could inflate its sales through excessive spending on advertising and promotions.
Caleres’s full-year EPS flipped from negative to positive over the last five years. This is encouraging and shows it’s at a critical moment in its life.
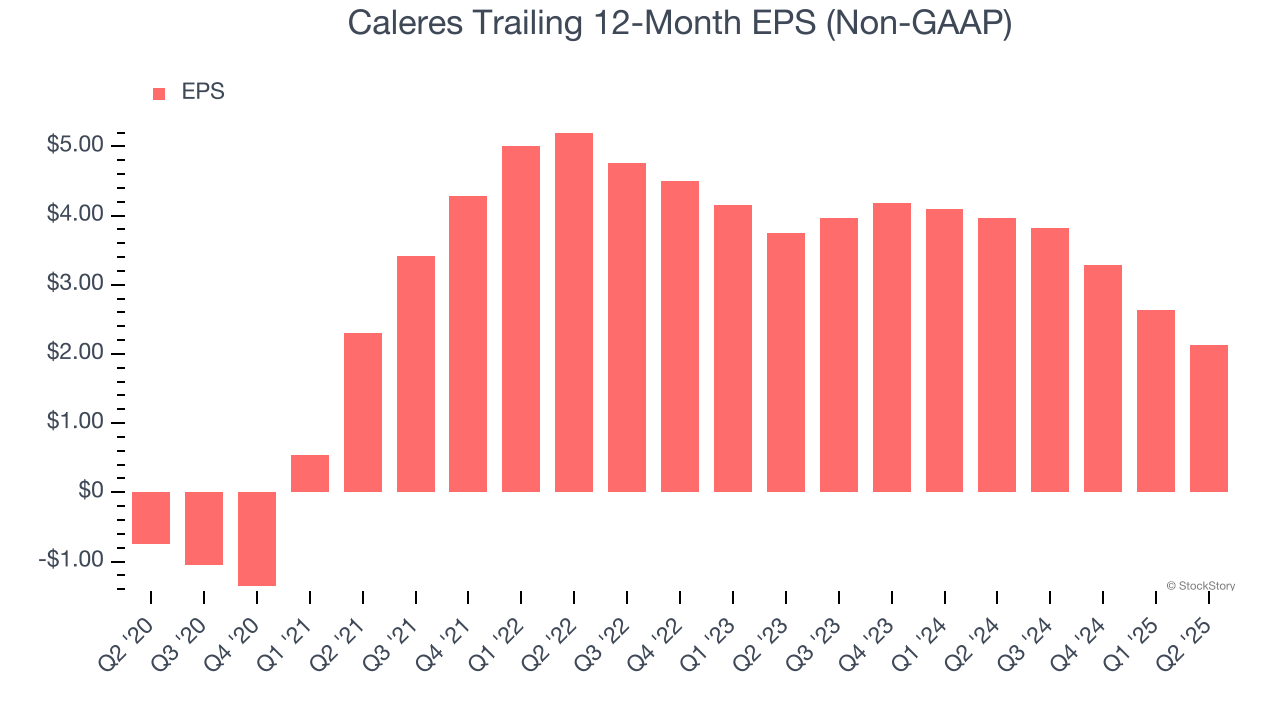
In Q2, Caleres reported adjusted EPS of $0.35, down from $0.85 in the same quarter last year. This print missed analysts’ estimates, but we care more about long-term adjusted EPS growth than short-term movements. Over the next 12 months, Wall Street expects Caleres’s full-year EPS of $2.13 to grow 22.7%.
Key Takeaways from Caleres’s Q2 Results
We struggled to find many positives in these results. Its EBITDA missed and its EPS fell short of Wall Street’s estimates. Overall, this was a weaker quarter. The stock traded down 12.7% to $13.06 immediately following the results.
Caleres underperformed this quarter, but does that create an opportunity to invest right now? We think that the latest quarter is only one piece of the longer-term business quality puzzle. Quality, when combined with valuation, can help determine if the stock is a buy. We cover that in our actionable full research report which you can read here, it’s free.


