Automation software company UiPath (NYSE: PATH) reported Q2 CY2025 results topping the market’s revenue expectations, with sales up 14.4% year on year to $361.7 million. Guidance for next quarter’s revenue was better than expected at $392.5 million at the midpoint, 1.7% above analysts’ estimates. Its non-GAAP profit of $0.15 per share was 79.8% above analysts’ consensus estimates.
Is now the time to buy UiPath? Find out by accessing our full research report, it’s free.
UiPath (PATH) Q2 CY2025 Highlights:
- Revenue: $361.7 million vs analyst estimates of $347.5 million (14.4% year-on-year growth, 4.1% beat)
- Adjusted EPS: $0.15 vs analyst estimates of $0.08 (79.8% beat)
- Adjusted Operating Income: $62.29 million vs analyst estimates of $40.08 million (17.2% margin, 55.4% beat)
- The company lifted its revenue guidance for the full year to $1.57 billion at the midpoint from $1.55 billion, a 1.4% increase
- Operating Margin: -5.6%, up from -32.7% in the same quarter last year
- Free Cash Flow Margin: 11.5%, down from 29.8% in the previous quarter
- Annual Recurring Revenue: $1.72 billion vs analyst estimates of $1.72 billion (11.1% year-on-year growth, in line)
- Market Capitalization: $5.82 billion
Company Overview
Starting with robotic process automation (RPA) and evolving into a comprehensive automation powerhouse, UiPath (NYSE: PATH) provides an AI-powered business automation platform that enables organizations to create software robots that mimic human actions to streamline repetitive tasks and processes.
Revenue Growth
Examining a company’s long-term performance can provide clues about its quality. Any business can put up a good quarter or two, but many enduring ones grow for years. Over the last three years, UiPath grew its sales at a 14.5% compounded annual growth rate. Although this growth is acceptable on an absolute basis, it fell short of our standards for the software sector, which enjoys a number of secular tailwinds.
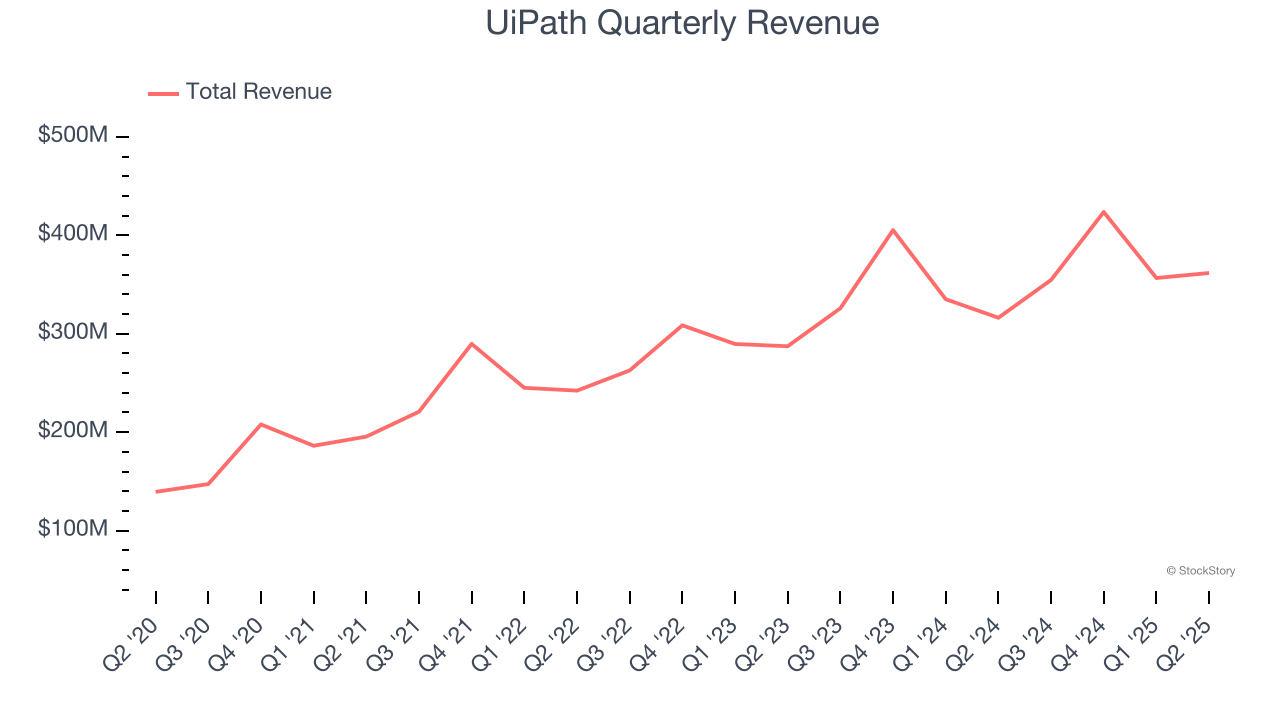
This quarter, UiPath reported year-on-year revenue growth of 14.4%, and its $361.7 million of revenue exceeded Wall Street’s estimates by 4.1%. Company management is currently guiding for a 10.7% year-on-year increase in sales next quarter.
Looking further ahead, sell-side analysts expect revenue to grow 7.7% over the next 12 months, a deceleration versus the last three years. This projection doesn't excite us and suggests its products and services will face some demand challenges.
Here at StockStory, we certainly understand the potential of thematic investing. Diverse winners from Microsoft (MSFT) to Alphabet (GOOG), Coca-Cola (KO) to Monster Beverage (MNST) could all have been identified as promising growth stories with a megatrend driving the growth. So, in that spirit, we’ve identified a relatively under-the-radar profitable growth stock benefiting from the rise of AI, available to you FREE via this link.
Annual Recurring Revenue
While reported revenue for a software company can include low-margin items like implementation fees, annual recurring revenue (ARR) is a sum of the next 12 months of contracted revenue purely from software subscriptions, or the high-margin, predictable revenue streams that make SaaS businesses so valuable.
UiPath’s ARR punched in at $1.72 billion in Q2, and over the last four quarters, its growth slightly outpaced the sector as it averaged 13.5% year-on-year increases. This alternate topline metric grew faster than total sales, which likely means that the recurring portions of the business are growing faster than less predictable, choppier ones such as implementation fees. That could be a good sign for future revenue growth. 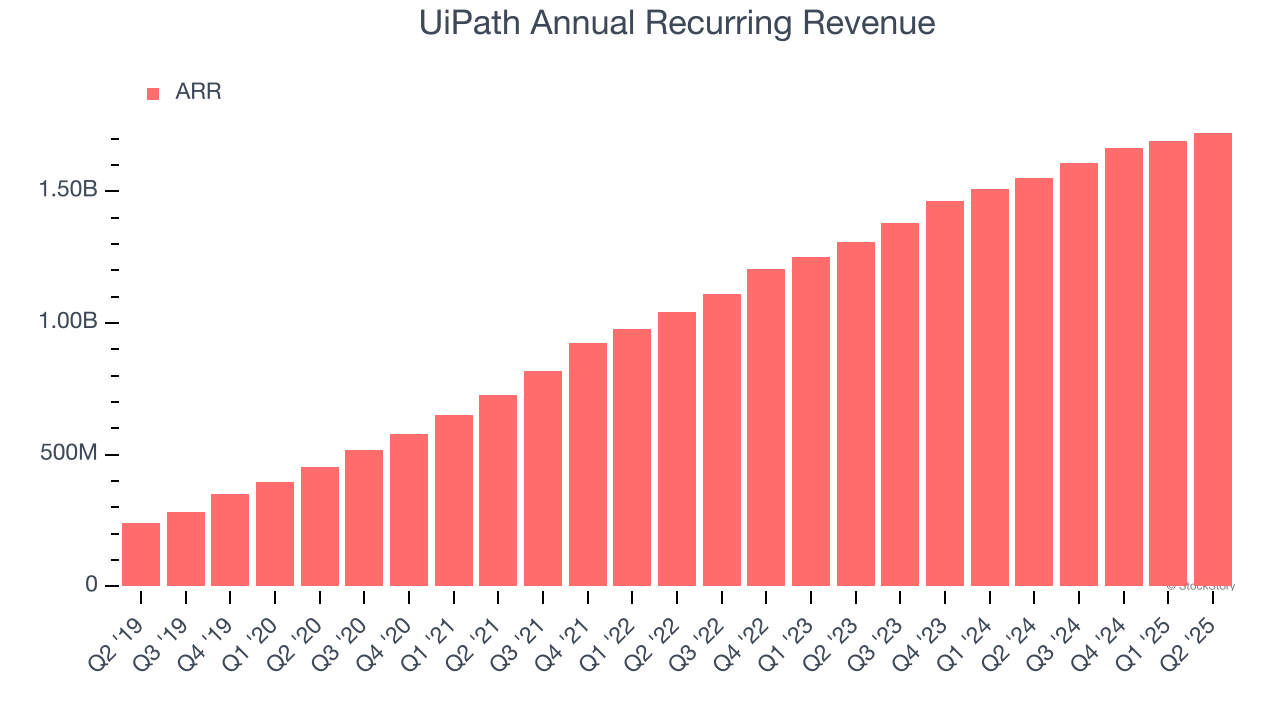
Customer Acquisition Efficiency
The customer acquisition cost (CAC) payback period represents the months required to recover the cost of acquiring a new customer. Essentially, it’s the break-even point for sales and marketing investments. A shorter CAC payback period is ideal, as it implies better returns on investment and business scalability.
UiPath is quite efficient at acquiring new customers, and its CAC payback period checked in at 32.6 months this quarter. The company’s rapid recovery of its customer acquisition costs indicates it has a strong brand reputation, giving it more resources pursue new product initiatives while maintaining the flexibility to increase its sales and marketing investments.
Key Takeaways from UiPath’s Q2 Results
This was a beat and raise quarter. It was encouraging to see UiPath beat analysts’ revenue and operating profit expectations this quarter. We were also glad its revenue guidance for next quarter exceeded Wall Street’s estimates. Lastly, full-year revenue guidance was raised. Overall, this print had some key positives. The stock traded up 3.5% to $11.20 immediately following the results.
Indeed, UiPath had a rock-solid quarterly earnings result, but is this stock a good investment here? We think that the latest quarter is only one piece of the longer-term business quality puzzle. Quality, when combined with valuation, can help determine if the stock is a buy. We cover that in our actionable full research report which you can read here, it’s free.