
Kura Sushi currently trades at $83.09 and has been a dream stock for shareholders. It’s returned 446% since September 2020, blowing past the S&P 500’s 94.8% gain. The company has also beaten the index over the past six months as its stock price is up 37.9% thanks to its solid quarterly results.
Is there a buying opportunity in Kura Sushi, or does it present a risk to your portfolio? Dive into our full research report to see our analyst team’s opinion, it’s free.
Why Is Kura Sushi Not Exciting?
Despite the momentum, we don't have much confidence in Kura Sushi. Here are three reasons we avoid KRUS and a stock we'd rather own.
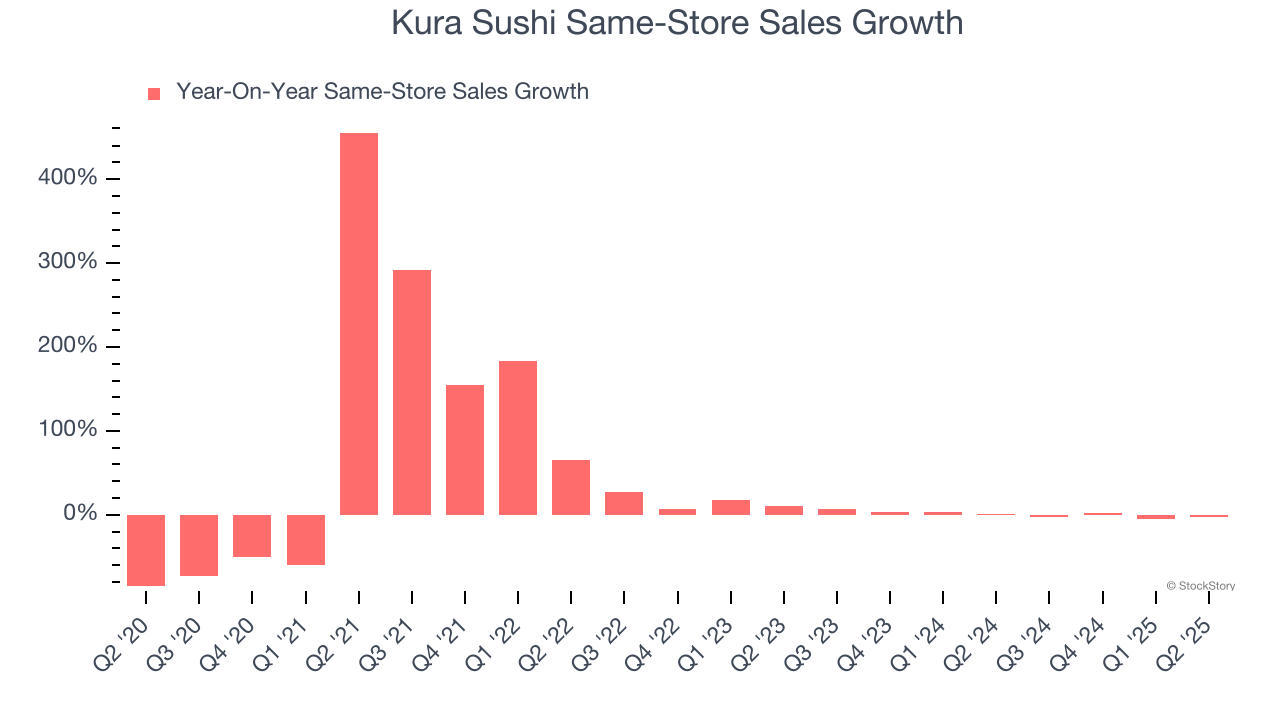
1. Flat Same-Store Sales Indicate Weak Demand
Same-store sales is an industry measure of whether revenue is growing at existing restaurants, and it is driven by customer visits (often called traffic) and the average spending per customer (ticket).
Kura Sushi’s demand within its existing dining locations has barely increased over the last two years as its same-store sales were flat.
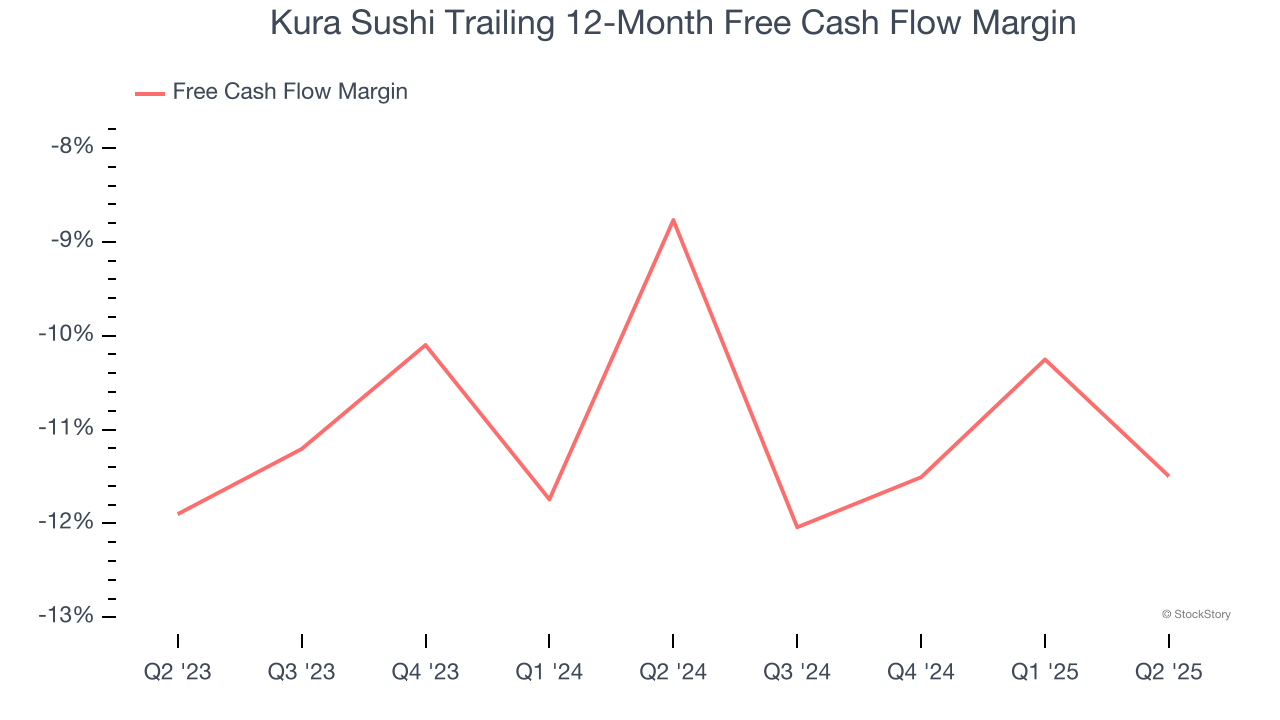
2. Cash Burn Ignites Concerns
Free cash flow isn't a prominently featured metric in company financials and earnings releases, but we think it's telling because it accounts for all operating and capital expenses, making it tough to manipulate. Cash is king.
Over the last two years, Kura Sushi’s capital-intensive business model and large investments in new physical locations have drained its resources, putting it in a pinch and limiting its ability to return capital to investors. Its free cash flow margin averaged negative 10.3%, meaning it lit $10.25 of cash on fire for every $100 in revenue.
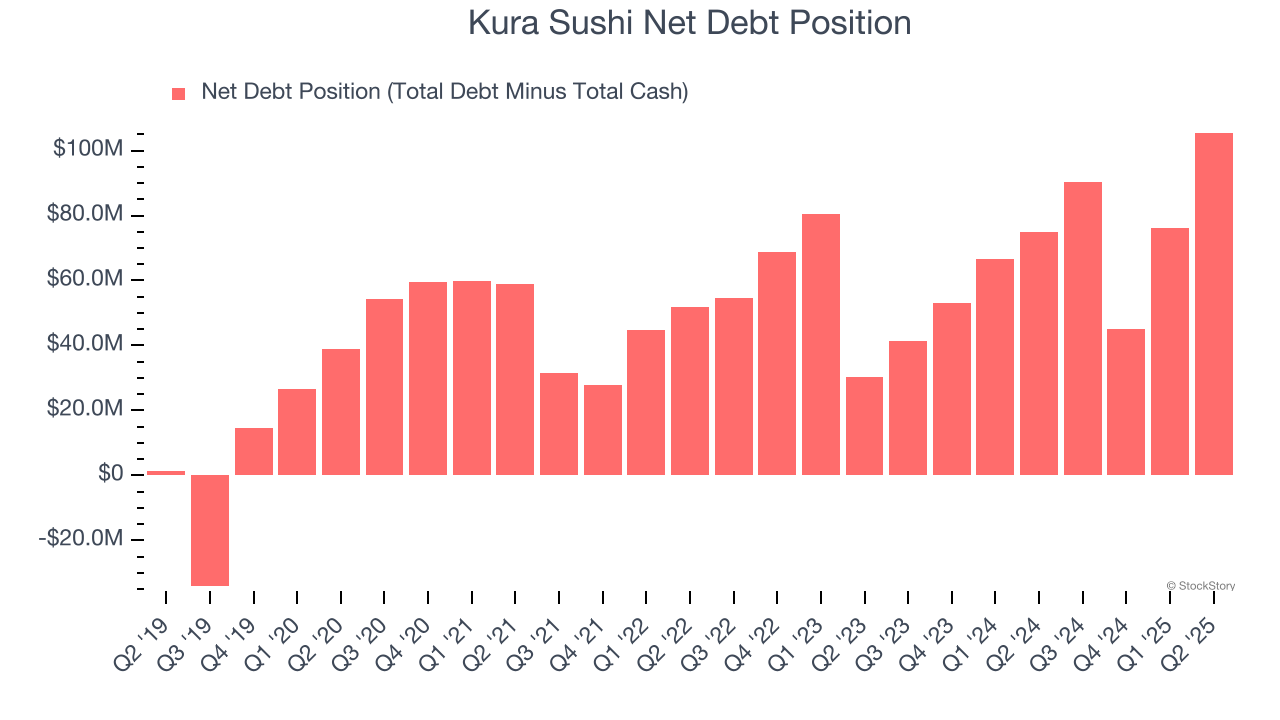
3. Short Cash Runway Exposes Shareholders to Potential Dilution
As long-term investors, the risk we care about most is the permanent loss of capital, which can happen when a company goes bankrupt or raises money from a disadvantaged position. This is separate from short-term stock price volatility, something we are much less bothered by.
Kura Sushi burned through $30.97 million of cash over the last year, and its $166 million of debt exceeds the $60.5 million of cash on its balance sheet. This is a deal breaker for us because indebted loss-making companies spell trouble.
Unless the Kura Sushi’s fundamentals change quickly, it might find itself in a position where it must raise capital from investors to continue operating. Whether that would be favorable is unclear because dilution is a headwind for shareholder returns.
We remain cautious of Kura Sushi until it generates consistent free cash flow or any of its announced financing plans materialize on its balance sheet.
Final Judgment
Kura Sushi’s business quality ultimately falls short of our standards. With its shares beating the market recently, the stock trades at 45.9× forward EV-to-EBITDA (or $83.09 per share). This multiple tells us a lot of good news is priced in - we think other companies feature superior fundamentals at the moment. We’d recommend looking at one of our top digital advertising picks.
Stocks We Like More Than Kura Sushi
When Trump unveiled his aggressive tariff plan in April 2025, markets tanked as investors feared a full-blown trade war. But those who panicked and sold missed the subsequent rebound that’s already erased most losses.
Don’t let fear keep you from great opportunities and take a look at Top 5 Strong Momentum Stocks for this week. This is a curated list of our High Quality stocks that have generated a market-beating return of 183% over the last five years (as of March 31st 2025).
Stocks that made our list in 2020 include now familiar names such as Nvidia (+1,545% between March 2020 and March 2025) as well as under-the-radar businesses like the once-small-cap company Exlservice (+354% five-year return). Find your next big winner with StockStory today.
StockStory is growing and hiring equity analyst and marketing roles. Are you a 0 to 1 builder passionate about the markets and AI? See the open roles here.


