
Facility services provider ABM Industries (NYSE: ABM) reported revenue ahead of Wall Street’s expectations in Q2 CY2025, with sales up 6.2% year on year to $2.22 billion. Its non-GAAP profit of $0.82 per share was 13.6% below analysts’ consensus estimates.
Is now the time to buy ABM? Find out by accessing our full research report, it’s free.
ABM (ABM) Q2 CY2025 Highlights:
- Revenue: $2.22 billion vs analyst estimates of $2.16 billion (6.2% year-on-year growth, 3% beat)
- Adjusted EPS: $0.82 vs analyst expectations of $0.95 (13.6% miss)
- Adjusted EBITDA: $125.8 million vs analyst estimates of $132.5 million (5.7% margin, 5.1% miss)
- Management reiterated its full-year Adjusted EPS guidance of $3.72 at the midpoint
- Operating Margin: 3.8%, up from 1.8% in the same quarter last year
- Free Cash Flow Margin: 6.8%, up from 3.1% in the same quarter last year
- Organic Revenue rose 5% year on year vs analyst estimates of 2.8% growth (223.5 basis point beat)
- Market Capitalization: $2.99 billion
“ABM’s third quarter performance was highlighted by mid-single-digit organic revenue growth and strong free cash flow,” said Scott Salmirs, President & Chief Executive Officer.
Company Overview
With roots dating back to 1909 as a window washing company, ABM Industries (NYSE: ABM) provides integrated facility management, infrastructure, and mobility solutions across various sectors including commercial, manufacturing, education, and aviation.
Revenue Growth
A company’s long-term sales performance is one signal of its overall quality. Even a bad business can shine for one or two quarters, but a top-tier one grows for years.
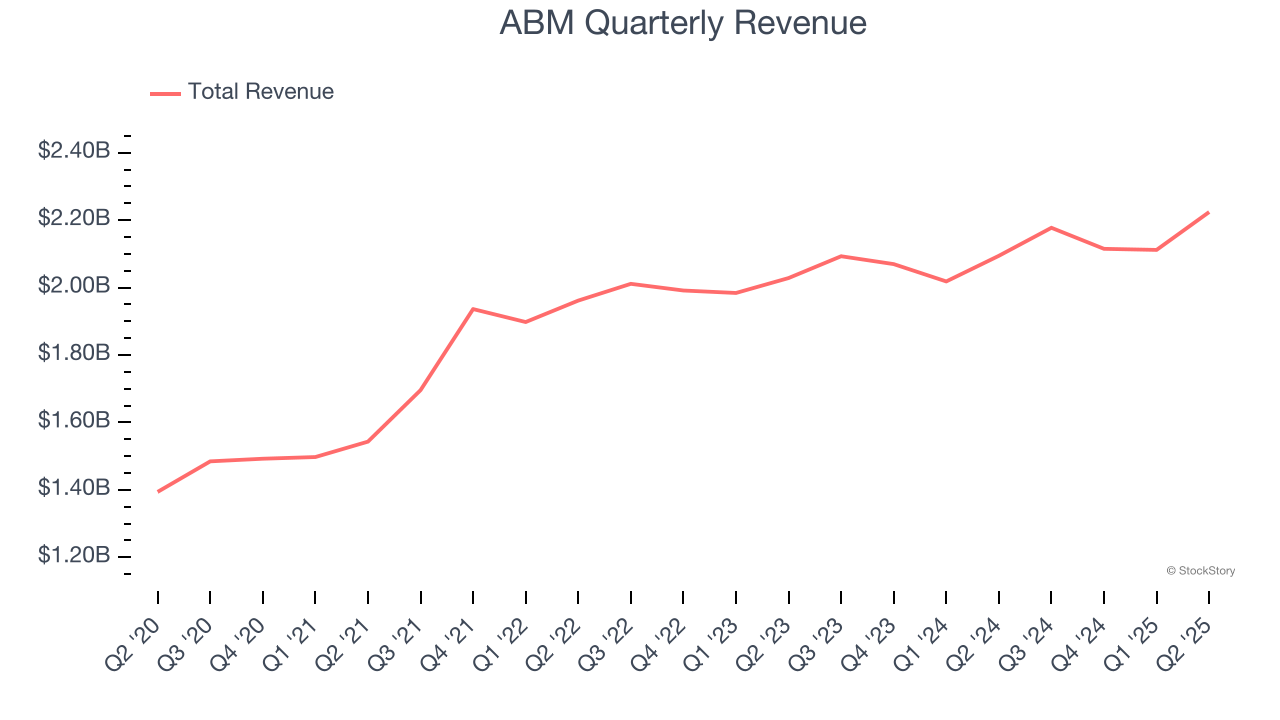
With $8.63 billion in revenue over the past 12 months, ABM is one of the larger companies in the business services industry and benefits from a well-known brand that influences purchasing decisions.
As you can see below, ABM’s 7% annualized revenue growth over the last five years was solid. This shows it had high demand, a useful starting point for our analysis.
Long-term growth is the most important, but within business services, a half-decade historical view may miss new innovations or demand cycles. ABM’s recent performance shows its demand has slowed as its annualized revenue growth of 3.8% over the last two years was below its five-year trend. 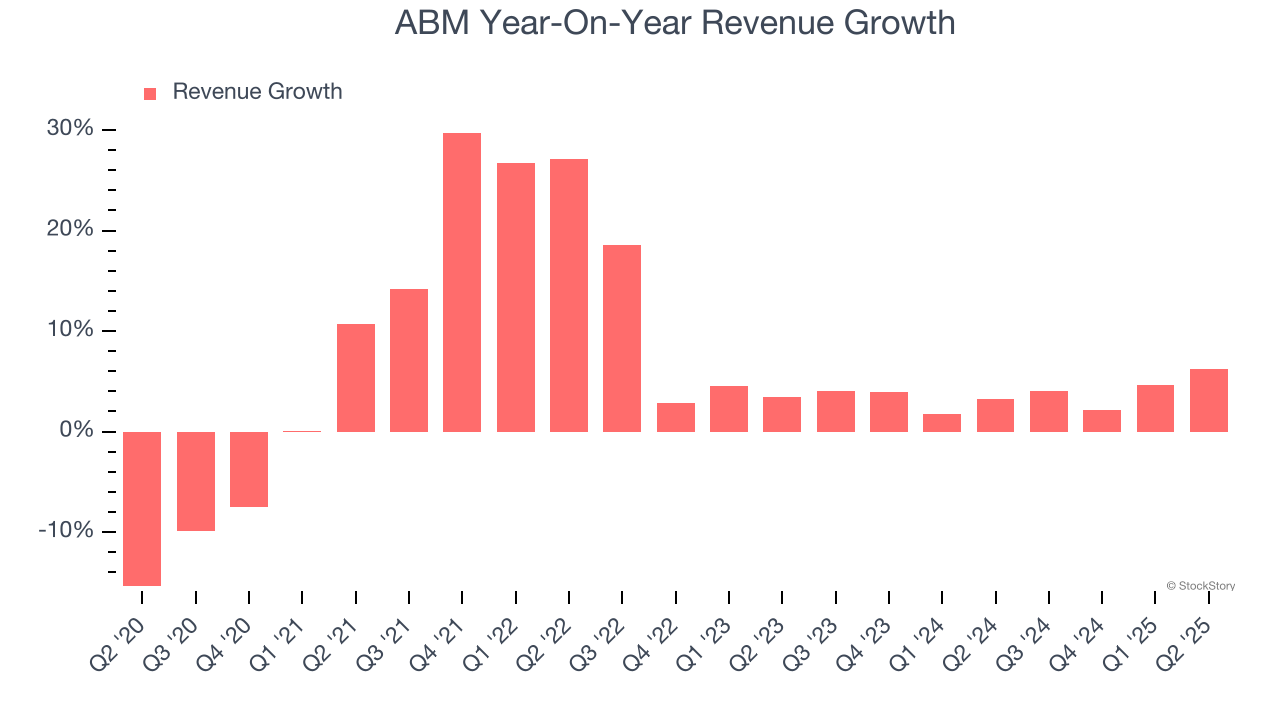
We can better understand the company’s sales dynamics by analyzing its organic revenue, which strips out one-time events like acquisitions and currency fluctuations that don’t accurately reflect its fundamentals. Over the last two years, ABM’s organic revenue averaged 3.2% year-on-year growth. Because this number aligns with its two-year revenue growth, we can see the company’s core operations (not acquisitions and divestitures) drove most of its results. 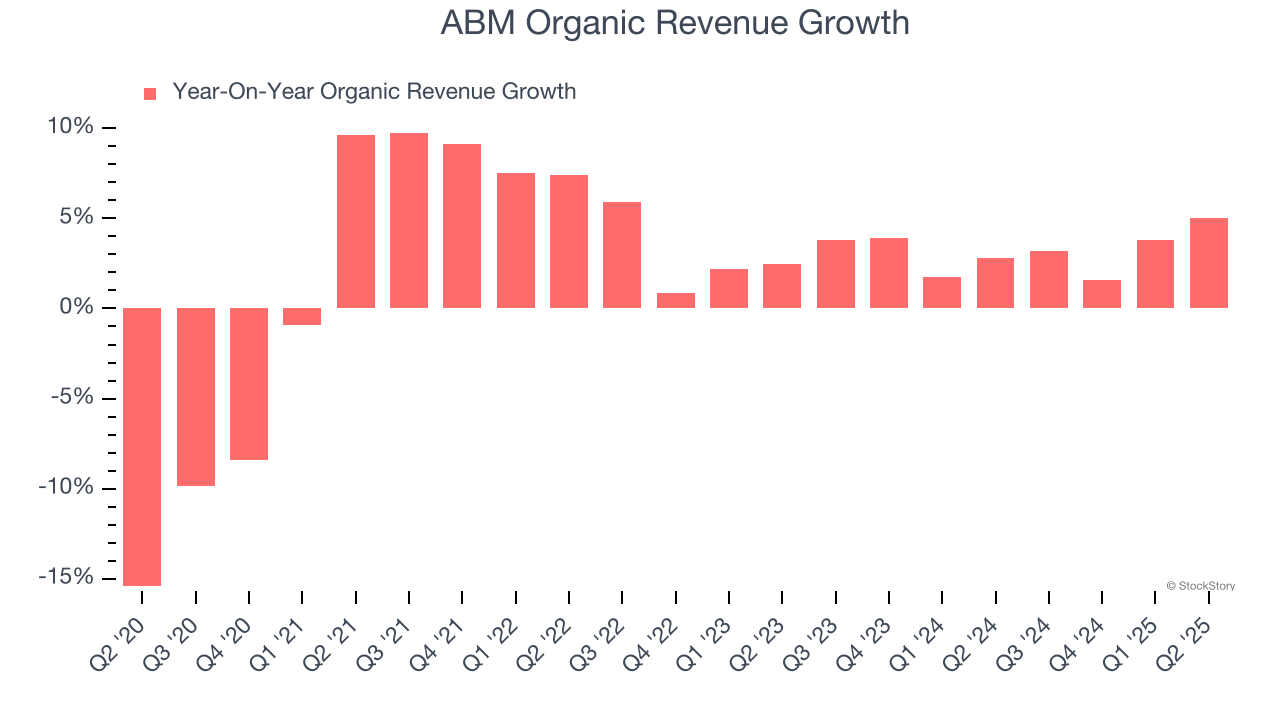
This quarter, ABM reported year-on-year revenue growth of 6.2%, and its $2.22 billion of revenue exceeded Wall Street’s estimates by 3%.
Looking ahead, sell-side analysts expect revenue to grow 2.6% over the next 12 months, similar to its two-year rate. This projection doesn't excite us and suggests its products and services will see some demand headwinds.
Here at StockStory, we certainly understand the potential of thematic investing. Diverse winners from Microsoft (MSFT) to Alphabet (GOOG), Coca-Cola (KO) to Monster Beverage (MNST) could all have been identified as promising growth stories with a megatrend driving the growth. So, in that spirit, we’ve identified a relatively under-the-radar profitable growth stock benefiting from the rise of AI, available to you FREE via this link.
Operating Margin
Operating margin is an important measure of profitability as it shows the portion of revenue left after accounting for all core expenses – everything from the cost of goods sold to advertising and wages. It’s also useful for comparing profitability across companies with different levels of debt and tax rates because it excludes interest and taxes.
ABM’s operating margin might fluctuated slightly over the last 12 months but has remained more or less the same, averaging 3.9% over the last five years. This profitability was lousy for a business services business and caused by its suboptimal cost structure.
Analyzing the trend in its profitability, ABM’s operating margin might fluctuated slightly but has generally stayed the same over the last five years. This raises questions about the company’s expense base because its revenue growth should have given it leverage on its fixed costs, resulting in better economies of scale and profitability.
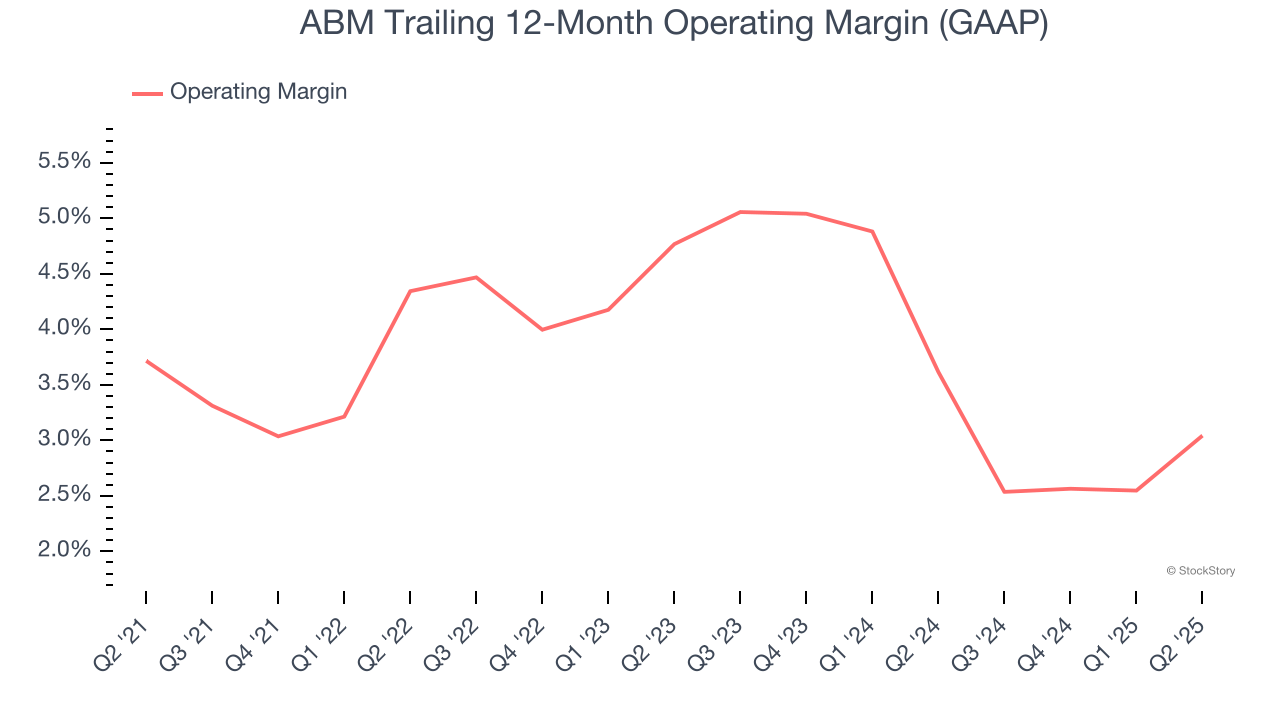
In Q2, ABM generated an operating margin profit margin of 3.8%, up 2 percentage points year on year. This increase was a welcome development and shows it was more efficient.
Earnings Per Share
We track the long-term change in earnings per share (EPS) for the same reason as long-term revenue growth. Compared to revenue, however, EPS highlights whether a company’s growth is profitable.
ABM’s decent 7.5% annual EPS growth over the last five years aligns with its revenue performance. This tells us it maintained its per-share profitability as it expanded.
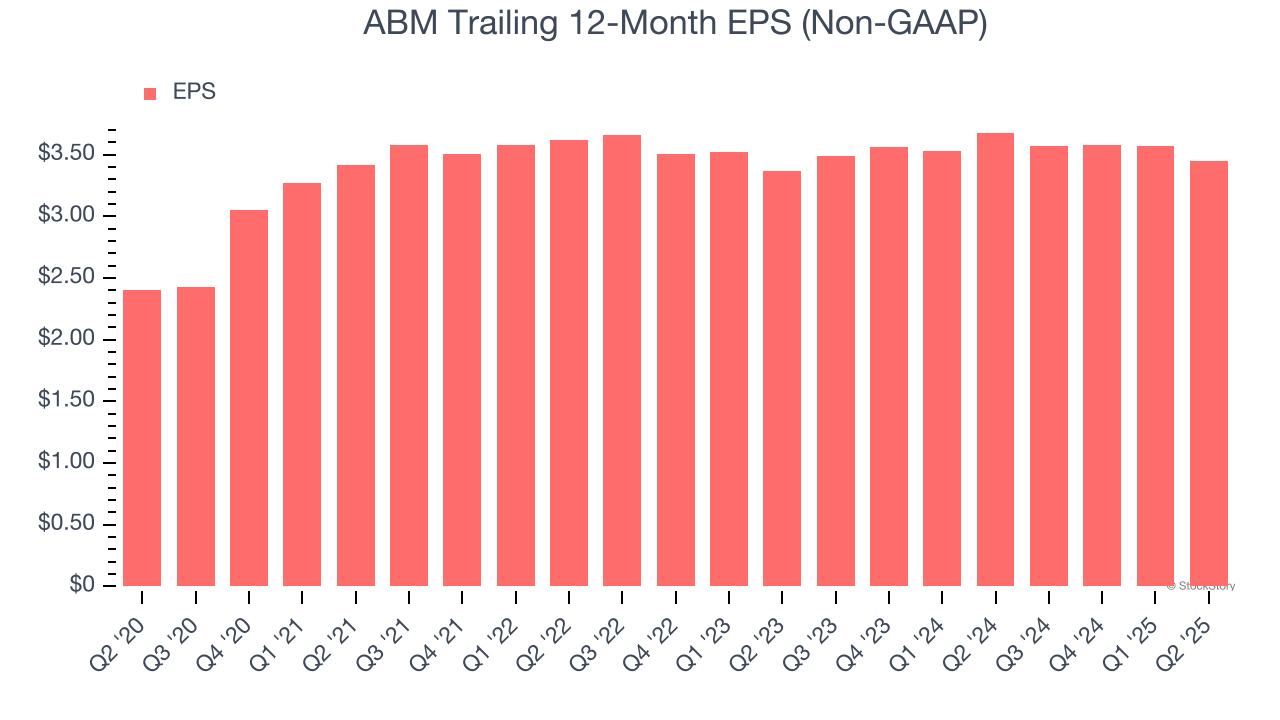
Like with revenue, we analyze EPS over a more recent period because it can provide insight into an emerging theme or development for the business.
ABM’s two-year annual EPS growth of 1.2% was subpar and lower than its 3.8% two-year revenue growth.
We can take a deeper look into ABM’s earnings to better understand the drivers of its performance. While we mentioned earlier that ABM’s operating margin expanded this quarter, a two-year view shows its margin has declined. This was the most relevant factor (aside from the revenue impact) behind its lower earnings; interest expenses and taxes can also affect EPS but don’t tell us as much about a company’s fundamentals.
In Q2, ABM reported adjusted EPS of $0.82, down from $0.94 in the same quarter last year. This print missed analysts’ estimates, but we care more about long-term adjusted EPS growth than short-term movements. Over the next 12 months, Wall Street expects ABM’s full-year EPS of $3.45 to grow 16.9%.
Key Takeaways from ABM’s Q2 Results
We enjoyed seeing ABM beat analysts’ organic revenue expectations this quarter. We were also glad its revenue outperformed Wall Street’s estimates. On the other hand, its EPS missed and its full-year EPS guidance fell slightly short of Wall Street’s estimates. Overall, this was a softer quarter. The stock traded down 4.4% to $46 immediately following the results.
The latest quarter from ABM’s wasn’t that good. One earnings report doesn’t define a company’s quality, though, so let’s explore whether the stock is a buy at the current price. If you’re making that decision, you should consider the bigger picture of valuation, business qualities, as well as the latest earnings. We cover that in our actionable full research report which you can read here, it’s free.