
Over the past six months, Omnicom Group’s stock price fell to $79.43. Shareholders have lost 7.1% of their capital, which is disappointing considering the S&P 500 has climbed by 15.5%. This may have investors wondering how to approach the situation.
Is now the time to buy Omnicom Group, or should you be careful about including it in your portfolio? See what our analysts have to say in our full research report, it’s free.
Why Is Omnicom Group Not Exciting?
Even with the cheaper entry price, we don't have much confidence in Omnicom Group. Here are three reasons why OMC doesn't excite us and a stock we'd rather own.
1. Slow Organic Growth Suggests Waning Demand In Core Business
In addition to reported revenue, organic revenue is a useful data point for analyzing Advertising & Marketing Services companies. This metric gives visibility into Omnicom Group’s core business because it excludes one-time events such as mergers, acquisitions, and divestitures along with foreign currency fluctuations - non-fundamental factors that can manipulate the income statement.
Over the last two years, Omnicom Group’s organic revenue averaged 4.4% year-on-year growth. This performance slightly lagged the sector and suggests it may need to improve its products, pricing, or go-to-market strategy, which can add an extra layer of complexity to its operations. 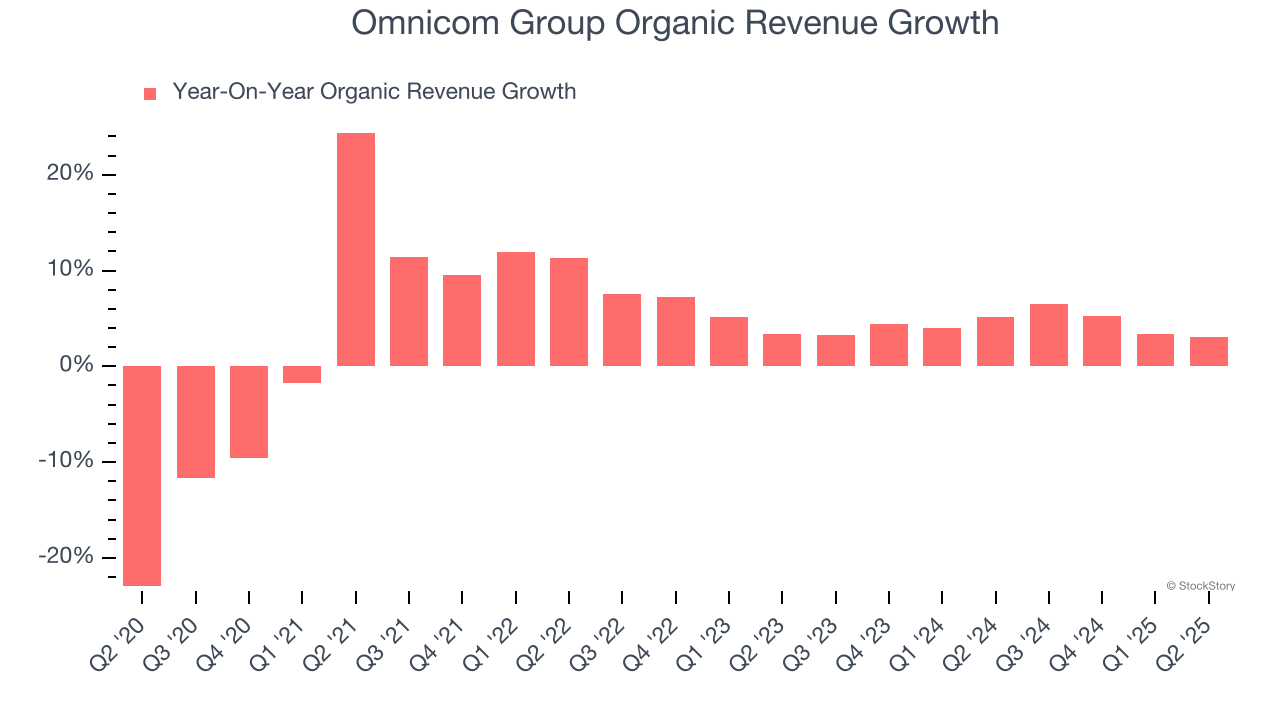
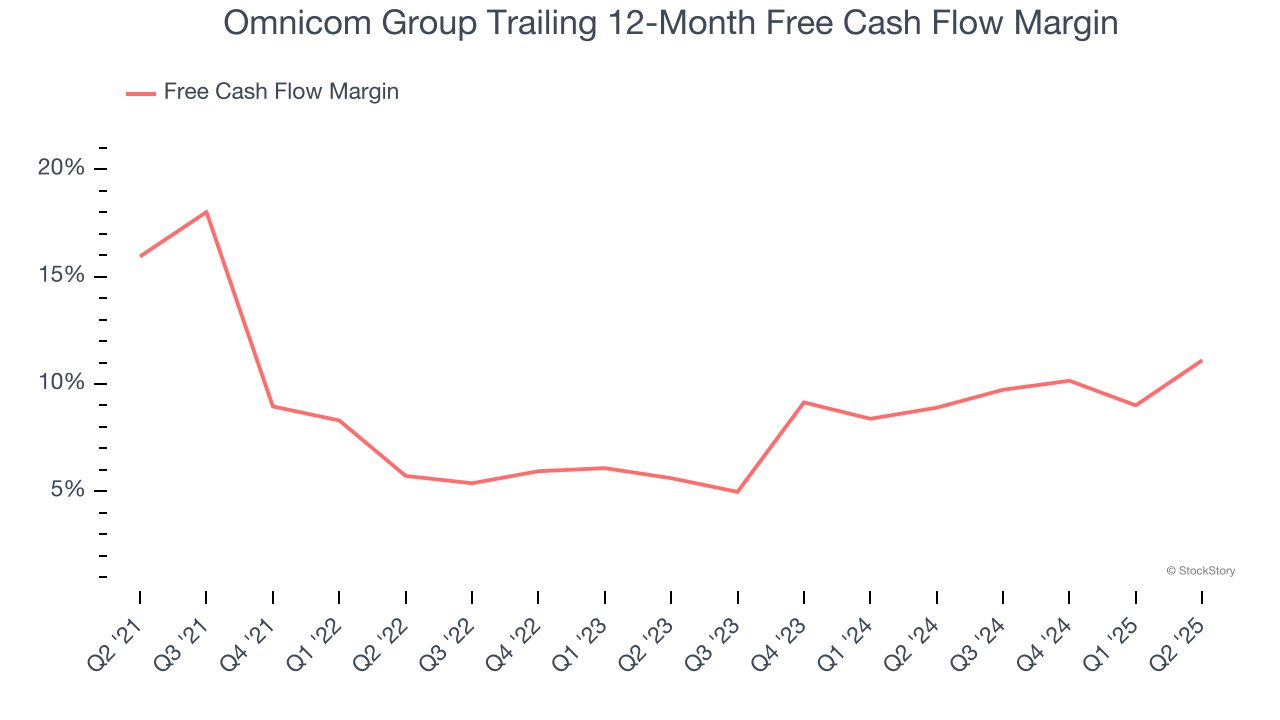
2. Free Cash Flow Margin Dropping
If you’ve followed StockStory for a while, you know we emphasize free cash flow. Why, you ask? We believe that in the end, cash is king, and you can’t use accounting profits to pay the bills.
As you can see below, Omnicom Group’s margin dropped by 4.8 percentage points over the last five years. It may have ticked higher more recently, but shareholders are likely hoping for its margin to at least revert to its historical level. If the longer-term trend returns, it could signal increasing investment needs and capital intensity. Omnicom Group’s free cash flow margin for the trailing 12 months was 11.1%.
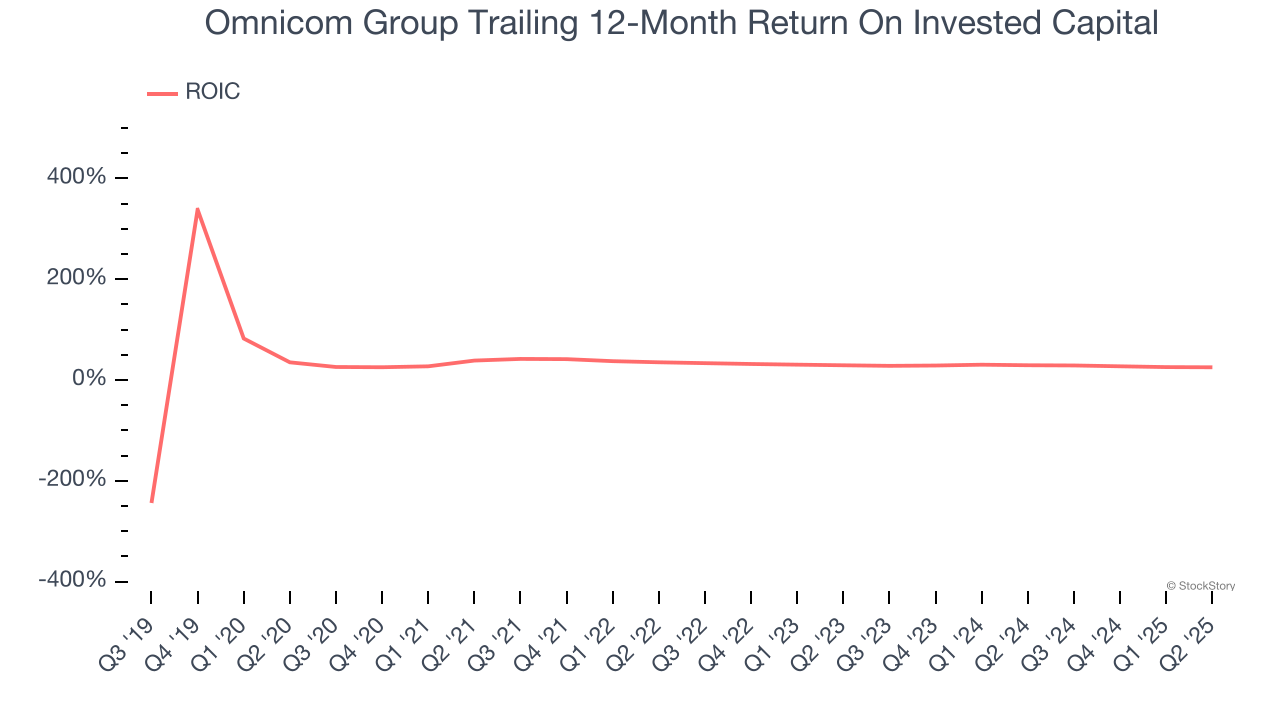
3. New Investments Fail to Bear Fruit as ROIC Declines
ROIC, or return on invested capital, is a metric showing how much operating profit a company generates relative to the money it has raised (debt and equity).
We like to invest in businesses with high returns, but the trend in a company’s ROIC is what often surprises the market and moves the stock price. Over the last few years, Omnicom Group’s ROIC has unfortunately decreased. We like what management has done in the past, but its declining returns are perhaps a symptom of fewer profitable growth opportunities.
Final Judgment
Omnicom Group isn’t a terrible business, but it isn’t one of our picks. Following the recent decline, the stock trades at 9.2× forward P/E (or $79.43 per share). This valuation is reasonable, but the company’s shakier fundamentals present too much downside risk. We're fairly confident there are better stocks to buy right now. We’d recommend looking at an all-weather company that owns household favorite Taco Bell.
Stocks We Would Buy Instead of Omnicom Group
Trump’s April 2025 tariff bombshell triggered a massive market selloff, but stocks have since staged an impressive recovery, leaving those who panic sold on the sidelines.
Take advantage of the rebound by checking out our Top 5 Strong Momentum Stocks for this week. This is a curated list of our High Quality stocks that have generated a market-beating return of 183% over the last five years (as of March 31st 2025).
Stocks that made our list in 2020 include now familiar names such as Nvidia (+1,545% between March 2020 and March 2025) as well as under-the-radar businesses like the once-small-cap company Comfort Systems (+782% five-year return). Find your next big winner with StockStory today.
StockStory is growing and hiring equity analyst and marketing roles. Are you a 0 to 1 builder passionate about the markets and AI? See the open roles here.