Over the last six months, Union Pacific’s shares have sunk to $221, producing a disappointing 11% loss - a stark contrast to the S&P 500’s 15.5% gain. This may have investors wondering how to approach the situation.
Is now the time to buy Union Pacific, or should you be careful about including it in your portfolio? Check out our in-depth research report to see what our analysts have to say, it’s free.
Why Do We Think Union Pacific Will Underperform?
Even with the cheaper entry price, we're cautious about Union Pacific. Here are three reasons why UNP doesn't excite us and a stock we'd rather own.
1. Weak Sales Volumes Indicate Waning Demand
Revenue growth can be broken down into changes in price and volume (the number of units sold). While both are important, volume is the lifeblood of a successful Rail Transportation company because there’s a ceiling to what customers will pay.
Over the last two years, Union Pacific’s units sold averaged 2.7% year-on-year growth. This performance was underwhelming and suggests it might have to lower prices or invest in product improvements to accelerate growth, factors that can hinder near-term profitability. 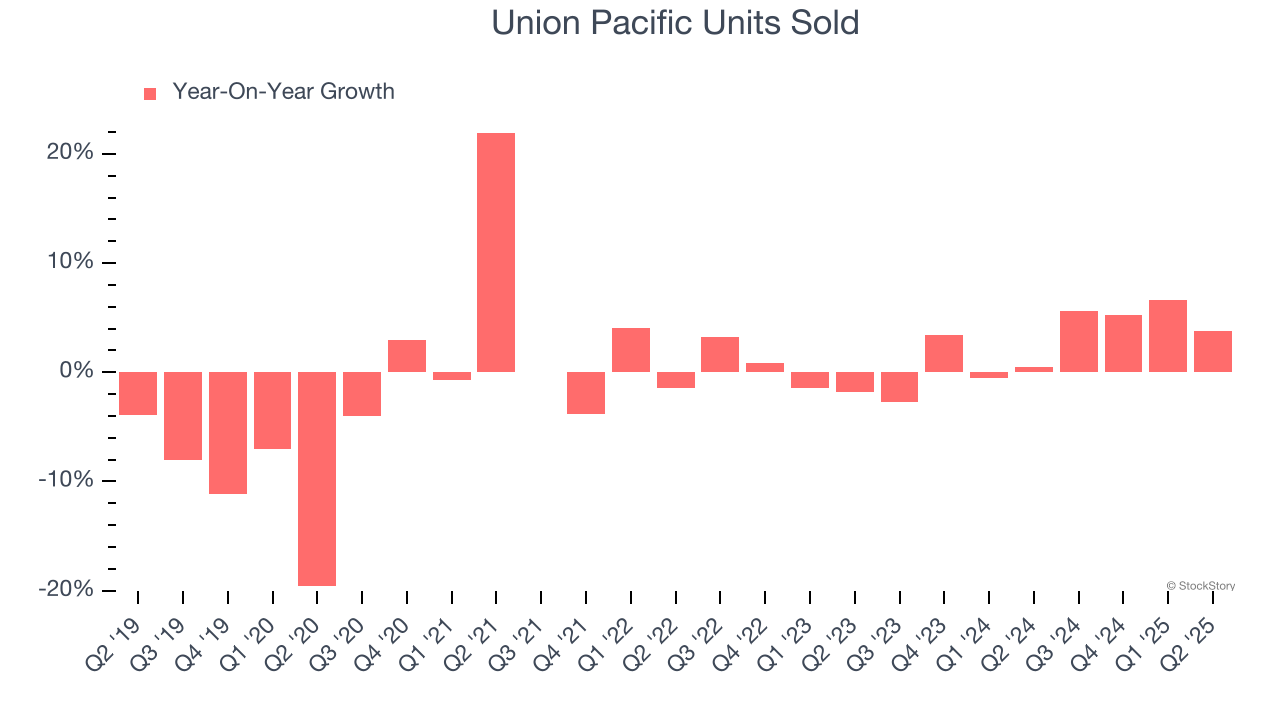
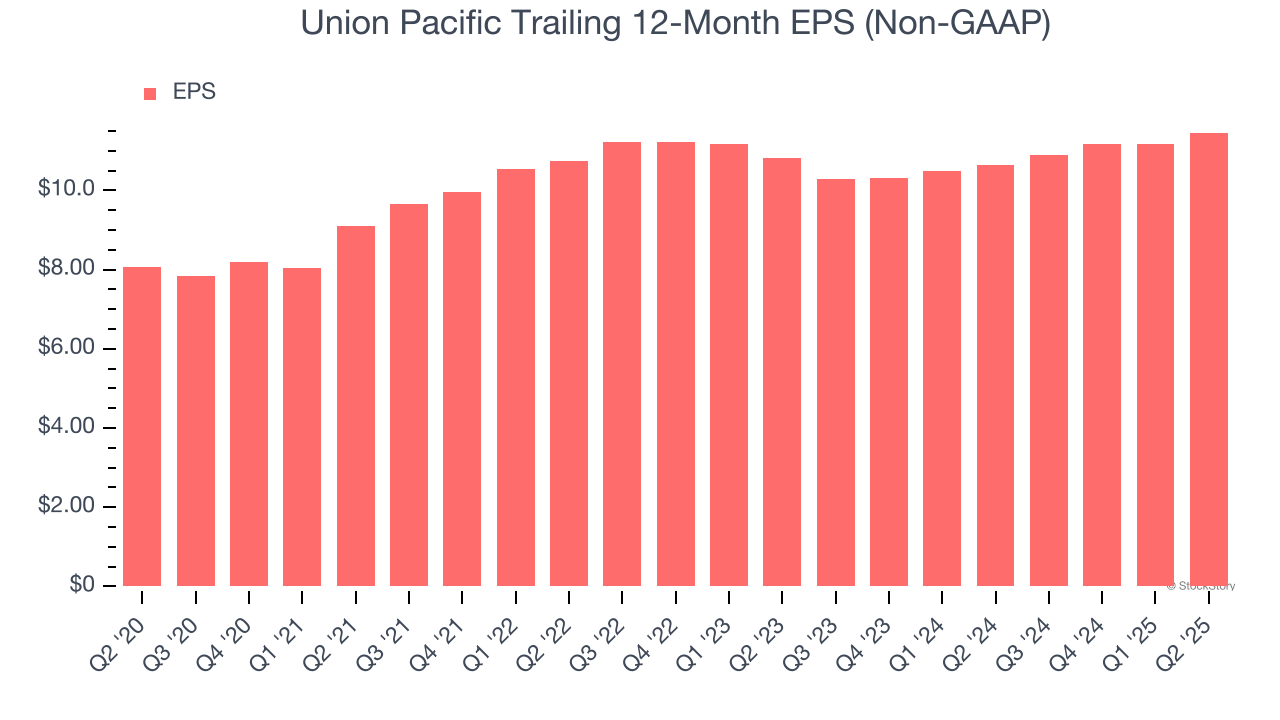
2. EPS Barely Growing
We track the long-term change in earnings per share (EPS) because it highlights whether a company’s growth is profitable.
Union Pacific’s EPS grew at an unimpressive 7.3% compounded annual growth rate over the last five years. On the bright side, this performance was better than its 3.8% annualized revenue growth and tells us the company became more profitable on a per-share basis as it expanded.
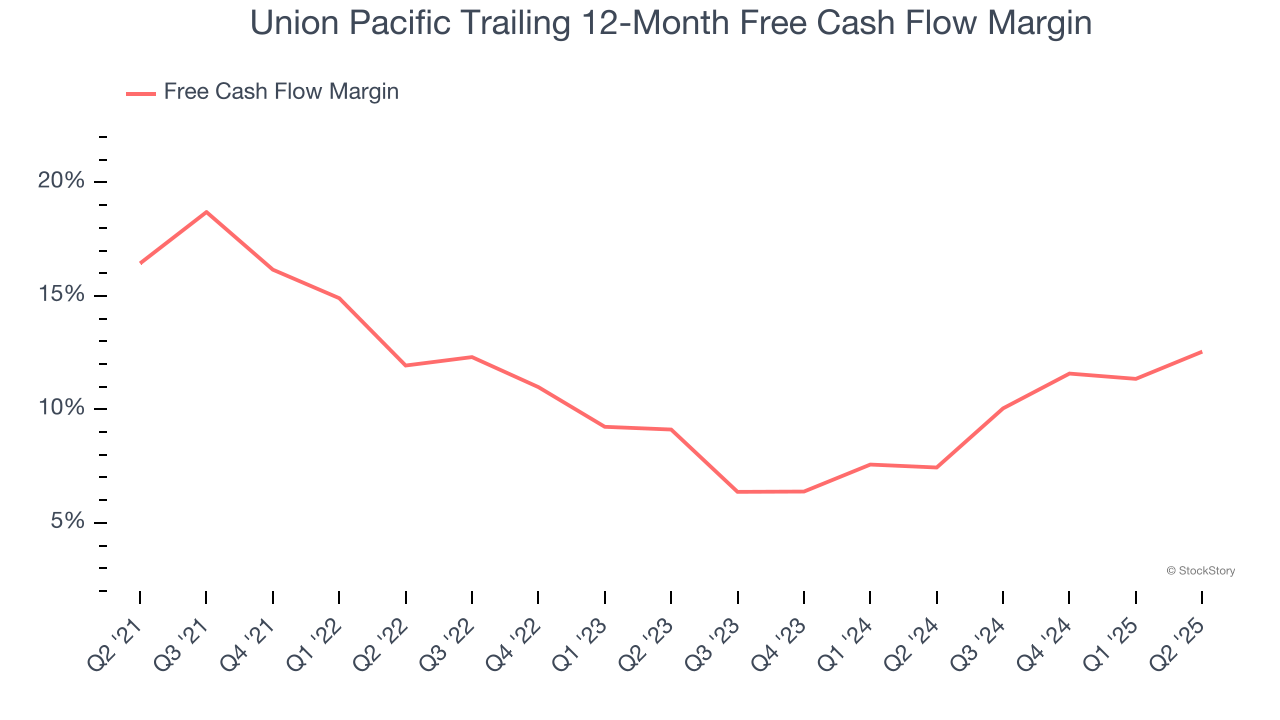
3. Free Cash Flow Margin Dropping
Free cash flow isn't a prominently featured metric in company financials and earnings releases, but we think it's telling because it accounts for all operating and capital expenses, making it tough to manipulate. Cash is king.
As you can see below, Union Pacific’s margin dropped by 3.9 percentage points over the last five years. It may have ticked higher more recently, but shareholders are likely hoping for its margin to at least revert to its historical level. If the longer-term trend returns, it could signal increasing investment needs and capital intensity. Union Pacific’s free cash flow margin for the trailing 12 months was 12.5%.
Final Judgment
Union Pacific falls short of our quality standards. After the recent drawdown, the stock trades at 18.1× forward P/E (or $221 per share). While this valuation is reasonable, we don’t see a big opportunity at the moment. There are better investments elsewhere. We’d recommend looking at one of our top software and edge computing picks.
High-Quality Stocks for All Market Conditions
When Trump unveiled his aggressive tariff plan in April 2025, markets tanked as investors feared a full-blown trade war. But those who panicked and sold missed the subsequent rebound that’s already erased most losses.
Don’t let fear keep you from great opportunities and take a look at Top 6 Stocks for this week. This is a curated list of our High Quality stocks that have generated a market-beating return of 183% over the last five years (as of March 31st 2025).
Stocks that made our list in 2020 include now familiar names such as Nvidia (+1,545% between March 2020 and March 2025) as well as under-the-radar businesses like the once-small-cap company Exlservice (+354% five-year return). Find your next big winner with StockStory today.
StockStory is growing and hiring equity analyst and marketing roles. Are you a 0 to 1 builder passionate about the markets and AI? See the open roles here.