Avocado company Mission Produce (NASDAQ: AVO) beat Wall Street’s revenue expectations in Q2 CY2025, with sales up 10.4% year on year to $357.7 million. Its non-GAAP profit of $0.26 per share was 79.3% above analysts’ consensus estimates.
Is now the time to buy Mission Produce? Find out by accessing our full research report, it’s free.
Mission Produce (AVO) Q2 CY2025 Highlights:
- Revenue: $357.7 million vs analyst estimates of $320.4 million (10.4% year-on-year growth, 11.7% beat)
- Adjusted EPS: $0.26 vs analyst estimates of $0.15 (79.3% beat)
- Adjusted EBITDA: $32.6 million vs analyst estimates of $25 million (9.1% margin, 30.4% beat)
- Operating Margin: 5.9%, in line with the same quarter last year
- Free Cash Flow Margin: 6.3%, down from 10.8% in the same quarter last year
- Sales Volumes rose 10% year on year (-10% in the same quarter last year)
- Market Capitalization: $891.9 million
Steve Barnard, CEO of Mission, stated, "This quarter, our commercial team demonstrated its unique ability to effectively program our owned Peruvian production to strategically deliver fruit into multiple global regions, resulting in supply consistency for our consumers and another quarter of strong financial performance. Our vertically integrated model, which combines a year-round sourcing network, owned production, global marketing and distribution capabilities and value-add services allows Mission to provide category leadership to drive global consumption. What's particularly encouraging is how our operations have adapted to market volatility — we've now demonstrated our ability to deliver solid results whether facing difficult supply conditions or favorable harvest environments, reflecting the consistency and operational excellence that helps us navigate various headwinds and capitalize on opportunities as they arise. With our strong operational performance and continued focus on working capital management, we generated $34 million of operating cash flow during the third quarter and expect to build on this in the fourth quarter as we sell the balance of our owned-crop inventory."
Company Overview
Founded in 1983 in California, Mission Produce (NASDAQ: AVO) grows, packages, and distributes avocados.
Revenue Growth
A company’s long-term performance is an indicator of its overall quality. Even a bad business can shine for one or two quarters, but a top-tier one grows for years.
With $1.43 billion in revenue over the past 12 months, Mission Produce is a small consumer staples company, which sometimes brings disadvantages compared to larger competitors benefiting from economies of scale and negotiating leverage with retailers. On the bright side, it can grow faster because it has a longer list of untapped store chains to sell into.
As you can see below, Mission Produce grew its sales at a decent 10.9% compounded annual growth rate over the last three years as consumers bought more of its products.
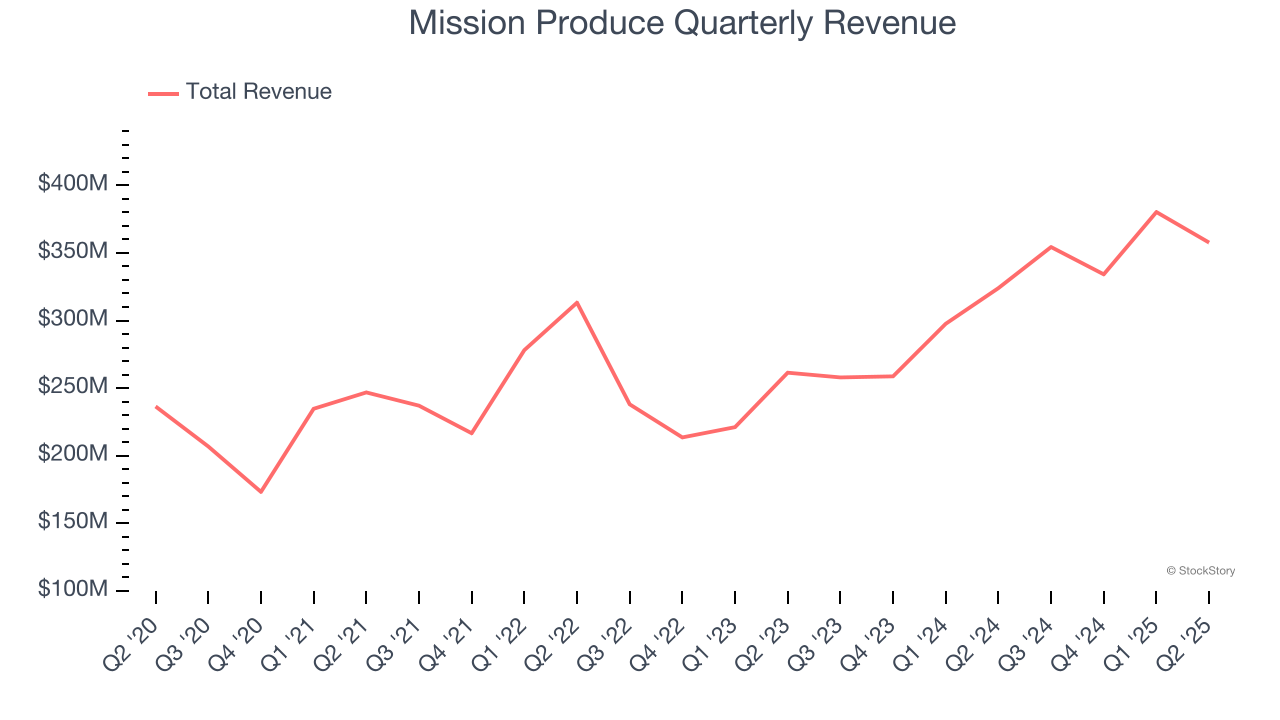
This quarter, Mission Produce reported year-on-year revenue growth of 10.4%, and its $357.7 million of revenue exceeded Wall Street’s estimates by 11.7%.
Looking ahead, sell-side analysts expect revenue to decline by 12.1% over the next 12 months, a deceleration versus the last three years. This projection doesn't excite us and suggests its products will see some demand headwinds.
Software is eating the world and there is virtually no industry left that has been untouched by it. That drives increasing demand for tools helping software developers do their jobs, whether it be monitoring critical cloud infrastructure, integrating audio and video functionality, or ensuring smooth content streaming. Click here to access a free report on our 3 favorite stocks to play this generational megatrend.
Volume Growth
Revenue growth can be broken down into changes in price and volume (the number of units sold). While both are important, volume is the lifeblood of a successful staples business as there’s a ceiling to what consumers will pay for everyday goods; they can always trade down to non-branded products if the branded versions are too expensive.
Mission Produce’s average quarterly volume growth was a healthy 1.1% over the last two years. This is pleasing because it shows consumers are purchasing more of its products. 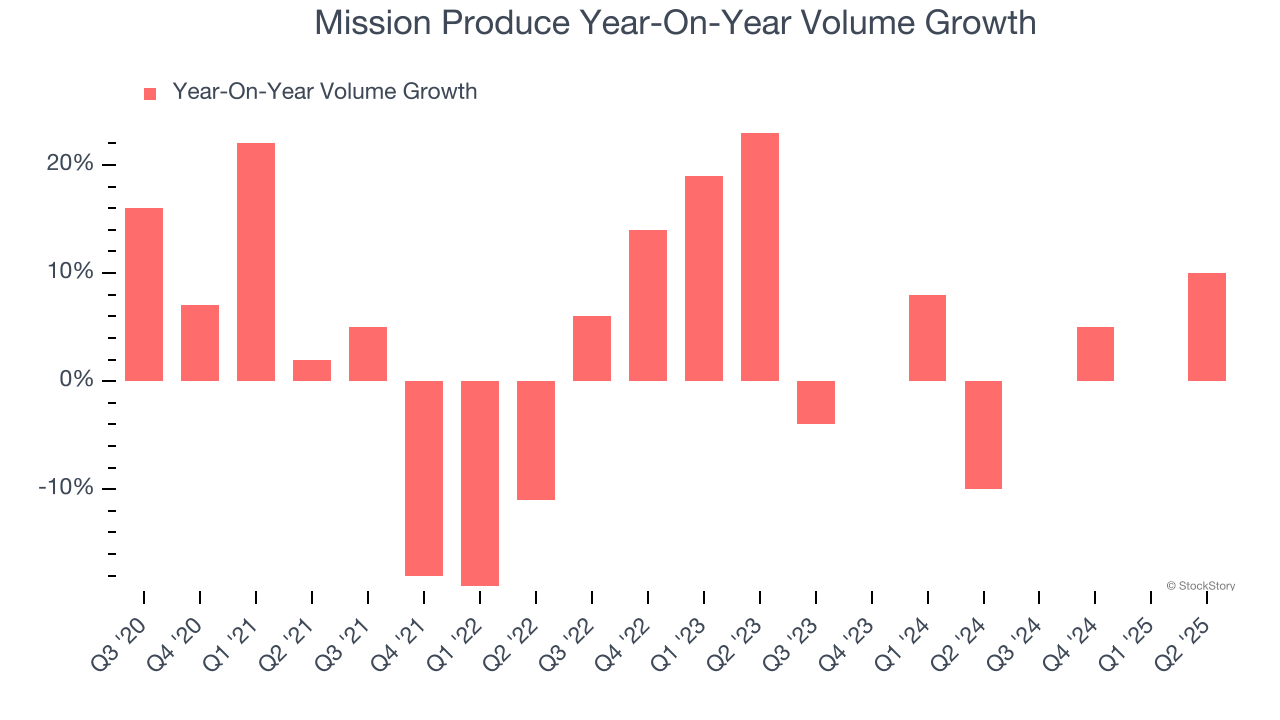
In Mission Produce’s Q2 2025, sales volumes jumped 10% year on year. This result was an acceleration from its historical levels, certainly a positive signal.
Key Takeaways from Mission Produce’s Q2 Results
It was good to see Mission Produce beat analysts’ EPS expectations this quarter. We were also excited its gross margin outperformed Wall Street’s estimates by a wide margin. Zooming out, we think this was a good print with some key areas of upside. The stock traded up 4% to $13.38 immediately after reporting.
Indeed, Mission Produce had a rock-solid quarterly earnings result, but is this stock a good investment here? The latest quarter does matter, but not nearly as much as longer-term fundamentals and valuation, when deciding if the stock is a buy. We cover that in our actionable full research report which you can read here, it’s free.