
Earnings results often indicate what direction a company will take in the months ahead. With Q2 behind us, let’s have a look at Carlisle (NYSE: CSL) and its peers.
Traditionally, building materials companies have built competitive advantages with economies of scale, brand recognition, and strong relationships with builders and contractors. More recently, advances to address labor availability and job site productivity have spurred innovation. Additionally, companies in the space that can produce more energy-efficient materials have opportunities to take share. However, these companies are at the whim of construction volumes, which tend to be cyclical and can be impacted heavily by economic factors such as interest rates. Additionally, the costs of raw materials can be driven by a myriad of worldwide factors and greatly influence the profitability of building materials companies.
The 8 building materials stocks we track reported a mixed Q2. As a group, revenues beat analysts’ consensus estimates by 1% while next quarter’s revenue guidance was in line.
Thankfully, share prices of the companies have been resilient as they are up 9.2% on average since the latest earnings results.
Weakest Q2: Carlisle (NYSE: CSL)
Originally founded as Carlisle Tire and Rubber Company, Carlisle Companies (NYSE: CSL) is a multi-industry product manufacturer focusing on construction materials and weatherproofing technologies.
Carlisle reported revenues of $1.45 billion, flat year on year. This print fell short of analysts’ expectations by 3.2%. Overall, it was a disappointing quarter for the company with a significant miss of analysts’ adjusted operating income estimates.
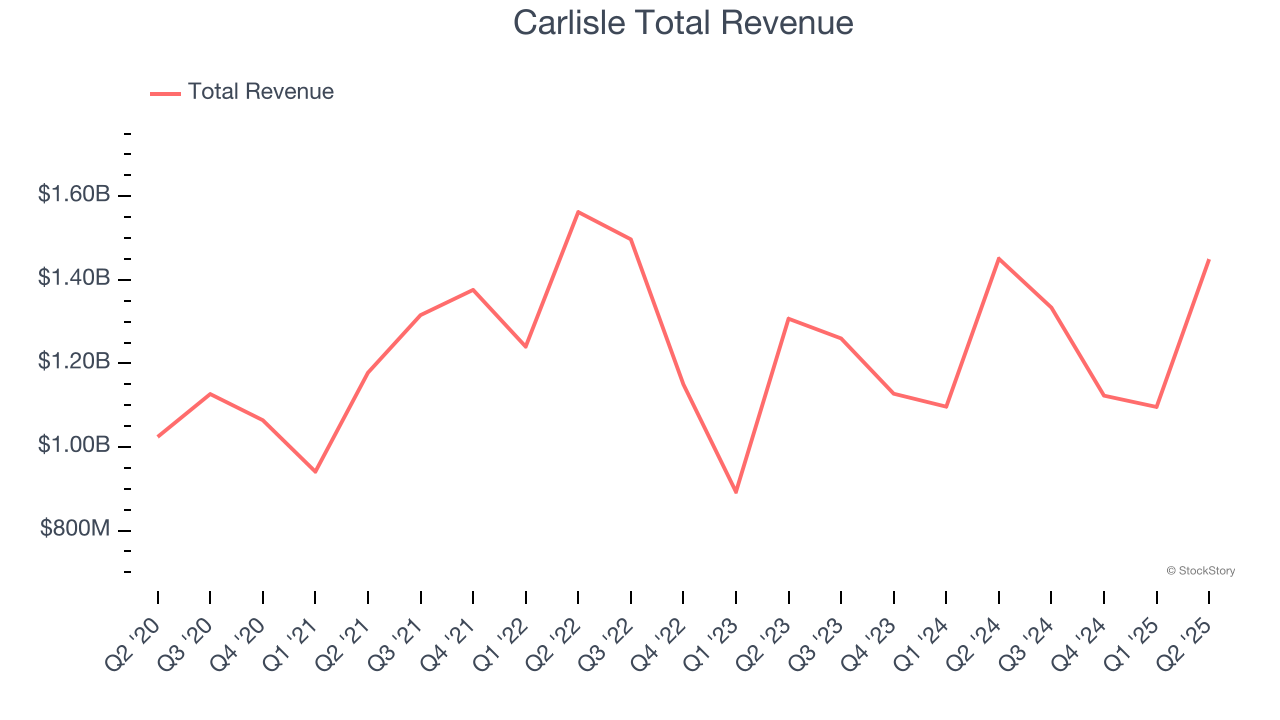
Unsurprisingly, the stock is down 3.1% since reporting and currently trades at $396.20.
Is now the time to buy Carlisle? Access our full analysis of the earnings results here, it’s free.
Best Q2: Armstrong World (NYSE: AWI)
Started as a two-man shop dating back to the 1860s, Armstrong (NYSE: AWI) provides ceiling and wall products to commercial and residential spaces.
Armstrong World reported revenues of $424.6 million, up 16.3% year on year, outperforming analysts’ expectations by 5.2%. The business had a stunning quarter with an impressive beat of analysts’ organic revenue estimates and a solid beat of analysts’ EBITDA estimates.
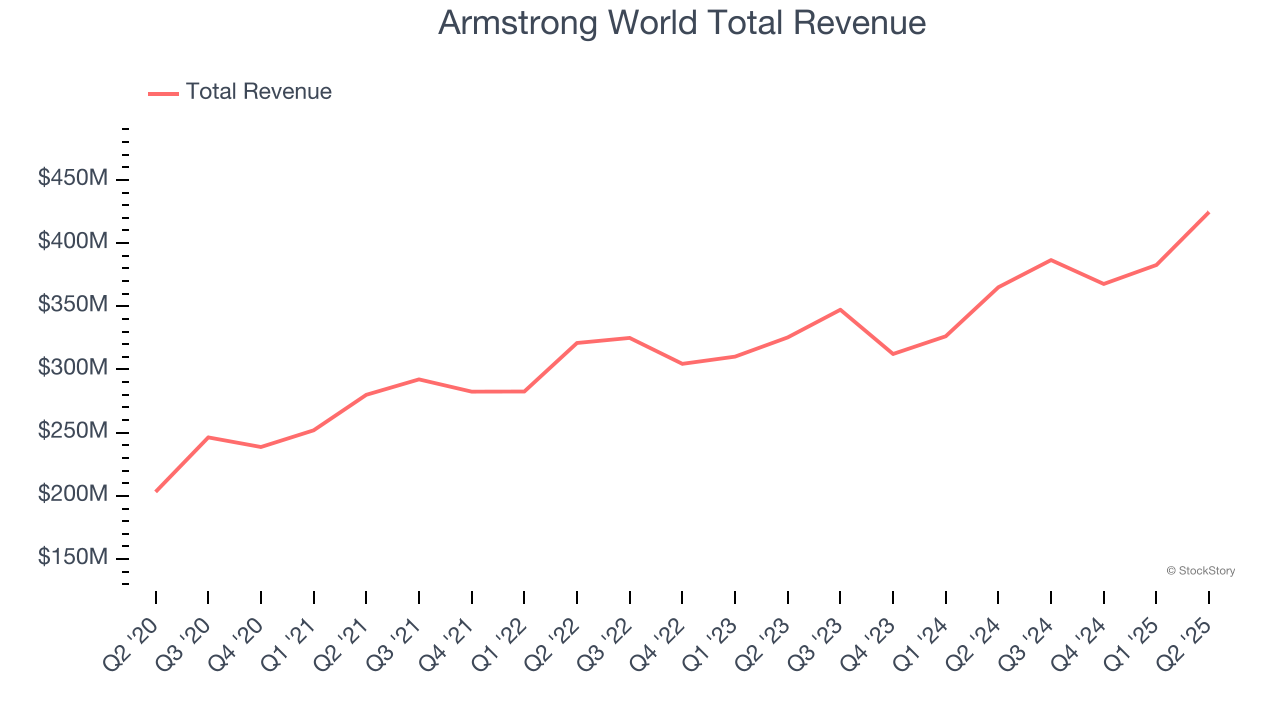
The market seems happy with the results as the stock is up 17.5% since reporting. It currently trades at $198.43.
Is now the time to buy Armstrong World? Access our full analysis of the earnings results here, it’s free.
Vulcan Materials (NYSE: VMC)
Founded in 1909, Vulcan Materials (NYSE: VMC) is a producer of construction aggregates, primarily crushed stone, sand, and gravel.
Vulcan Materials reported revenues of $2.10 billion, up 4.4% year on year, falling short of analysts’ expectations by 4.8%. It was a disappointing quarter as it posted a significant miss of analysts’ adjusted operating income estimates and a significant miss of analysts’ EBITDA estimates.
Vulcan Materials delivered the weakest performance against analyst estimates in the group. Interestingly, the stock is up 8.1% since the results and currently trades at $294.81.
Read our full analysis of Vulcan Materials’s results here.
Tecnoglass (NYSE: TGLS)
The first-ever Colombian company to trade on the NASDAQ, Tecnoglass (NYSE: TGLS) is a manufacturer of architectural glass, windows, and aluminum products.
Tecnoglass reported revenues of $255.5 million, up 16.3% year on year. This print surpassed analysts’ expectations by 4.3%. Overall, it was a very strong quarter as it also produced a solid beat of analysts’ EBITDA estimates and an impressive beat of analysts’ adjusted operating income estimates.
The stock is down 7.1% since reporting and currently trades at $72.74.
Read our full, actionable report on Tecnoglass here, it’s free.
Valmont (NYSE: VMI)
Credited with an invention in the 1950s that improved crop yields, Valmont (NYSE: VMI) provides engineered products and infrastructure services for the agricultural industry.
Valmont reported revenues of $1.05 billion, up 1% year on year. This result topped analysts’ expectations by 1.7%. Aside from that, it was a satisfactory quarter as it also produced an impressive beat of analysts’ adjusted operating income estimates but full-year EPS guidance slightly missing analysts’ expectations.
Valmont had the weakest full-year guidance update among its peers. The stock is up 13.8% since reporting and currently trades at $377.91.
Read our full, actionable report on Valmont here, it’s free.
Market Update
Thanks to the Fed’s rate hikes in 2022 and 2023, inflation has been on a steady path downward, easing back toward that 2% sweet spot. Fortunately (miraculously to some), all this tightening didn’t send the economy tumbling into a recession, so here we are, cautiously celebrating a soft landing. The cherry on top? Recent rate cuts (half a point in September 2024, a quarter in November) have propped up markets, especially after Trump’s November win lit a fire under major indices and sent them to all-time highs. However, there’s still plenty to ponder — tariffs, corporate tax cuts, and what 2025 might hold for the economy.
Want to invest in winners with rock-solid fundamentals? Check out our 9 Best Market-Beating Stocks and add them to your watchlist. These companies are poised for growth regardless of the political or macroeconomic climate.
StockStory is growing and hiring equity analyst and marketing roles. Are you a 0 to 1 builder passionate about the markets and AI? See the open roles here.