
While the S&P 500 is up 15.7% since March 2025, Agilent (currently trading at $128.85 per share) has lagged behind, posting a return of 5.7%. This might have investors contemplating their next move.
Is there a buying opportunity in Agilent, or does it present a risk to your portfolio? See what our analysts have to say in our full research report, it’s free.
Why Is Agilent Not Exciting?
We're swiping left on Agilent for now. Here are three reasons we avoid A and a stock we'd rather own.
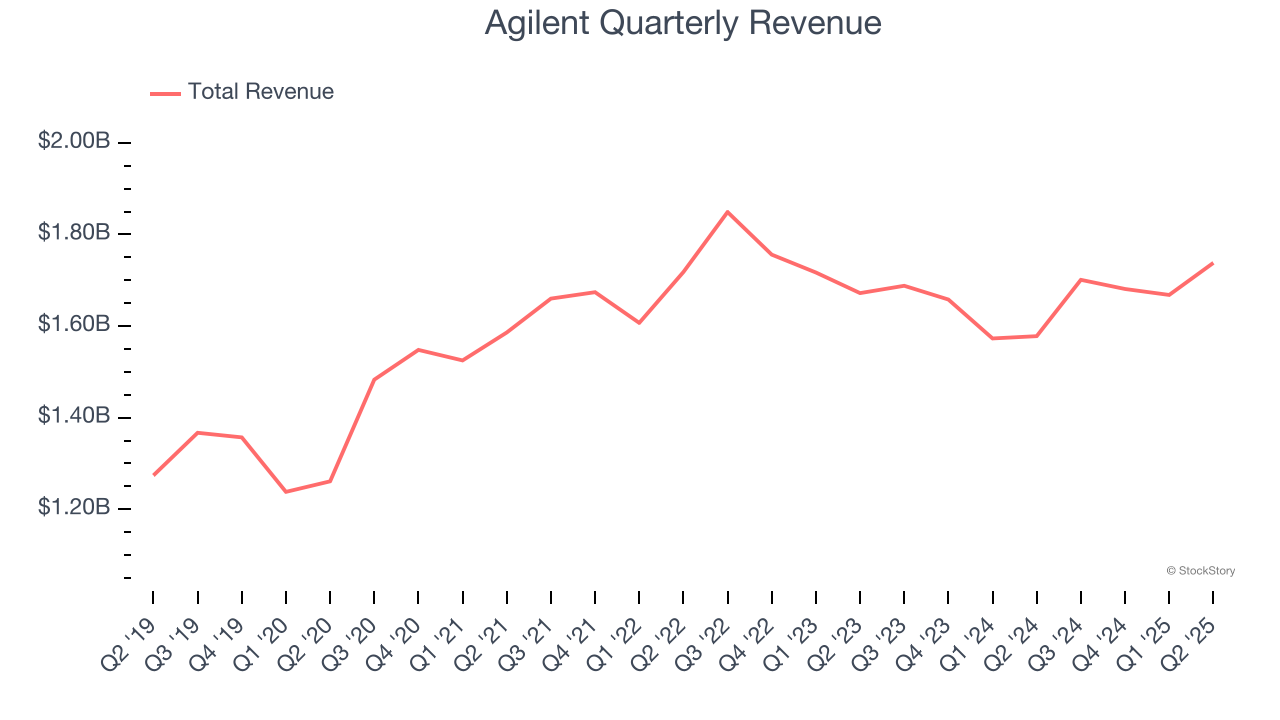
1. Long-Term Revenue Growth Disappoints
Examining a company’s long-term performance can provide clues about its quality. Even a bad business can shine for one or two quarters, but a top-tier one grows for years. Unfortunately, Agilent’s 5.4% annualized revenue growth over the last five years was mediocre. This was below our standard for the healthcare sector.
2. Core Business Falling Behind as Demand Declines
In addition to reported revenue, organic revenue is a useful data point for analyzing Research Tools & Consumables companies. This metric gives visibility into Agilent’s core business because it excludes one-time events such as mergers, acquisitions, and divestitures along with foreign currency fluctuations - non-fundamental factors that can manipulate the income statement.
Over the last two years, Agilent’s organic revenue averaged 2% year-on-year declines. This performance was underwhelming and implies it may need to improve its products, pricing, or go-to-market strategy. It also suggests Agilent might have to lean into acquisitions to grow, which isn’t ideal because M&A can be expensive and risky (integrations often disrupt focus). 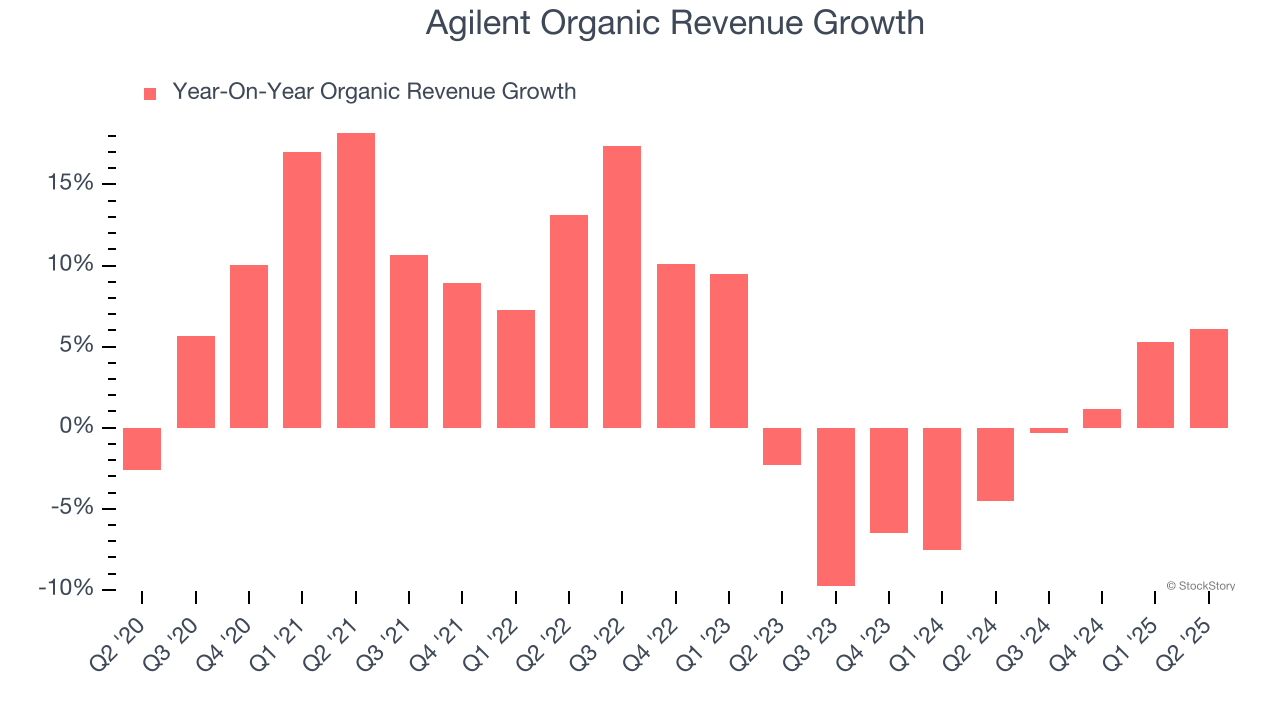
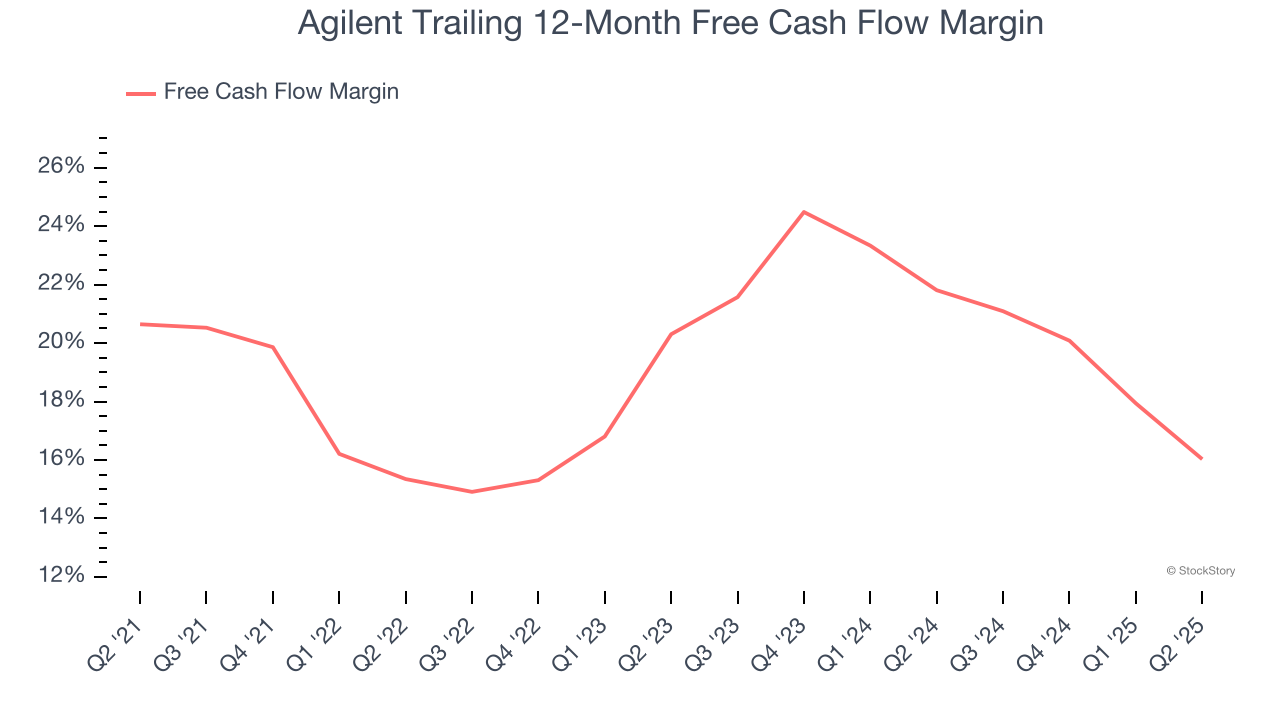
3. Free Cash Flow Margin Dropping
If you’ve followed StockStory for a while, you know we emphasize free cash flow. Why, you ask? We believe that in the end, cash is king, and you can’t use accounting profits to pay the bills.
As you can see below, Agilent’s margin dropped by 4.6 percentage points over the last five years. If its declines continue, it could signal increasing investment needs and capital intensity. Agilent’s free cash flow margin for the trailing 12 months was 16%.
Final Judgment
Agilent isn’t a terrible business, but it doesn’t pass our bar. With its shares trailing the market in recent months, the stock trades at 21.5× forward P/E (or $128.85 per share). Investors with a higher risk tolerance might like the company, but we don’t really see a big opportunity at the moment. We're fairly confident there are better investments elsewhere. We’d recommend looking at one of our top digital advertising picks.
High-Quality Stocks for All Market Conditions
Donald Trump’s April 2025 "Liberation Day" tariffs sent markets into a tailspin, but stocks have since rebounded strongly, proving that knee-jerk reactions often create the best buying opportunities.
The smart money is already positioning for the next leg up. Don’t miss out on the recovery - check out our Top 6 Stocks for this week. This is a curated list of our High Quality stocks that have generated a market-beating return of 183% over the last five years (as of March 31st 2025).
Stocks that made our list in 2020 include now familiar names such as Nvidia (+1,545% between March 2020 and March 2025) as well as under-the-radar businesses like the once-small-cap company Exlservice (+354% five-year return). Find your next big winner with StockStory today.
StockStory is growing and hiring equity analyst and marketing roles. Are you a 0 to 1 builder passionate about the markets and AI? See the open roles here.