
Since January 2021, the S&P 500 has delivered a total return of 78.3%. But one standout stock has more than doubled the market - over the past five years, RBC Bearings has surged 178% to $504.77 per share. Its momentum hasn’t stopped as it’s also gained 29.7% in the last six months thanks to its solid quarterly results, beating the S&P by 21.6%.
Is now still a good time to buy RBC? Or are investors being too optimistic? Find out in our full research report, it’s free.
Why Is RBC a Good Business?
With a Guinness World Record for engineering the largest spherical plain bearing, RBC Bearings (NYSE: RBC) is a manufacturer of bearings and related components for the aerospace & defense, industrial, and transportation industries.
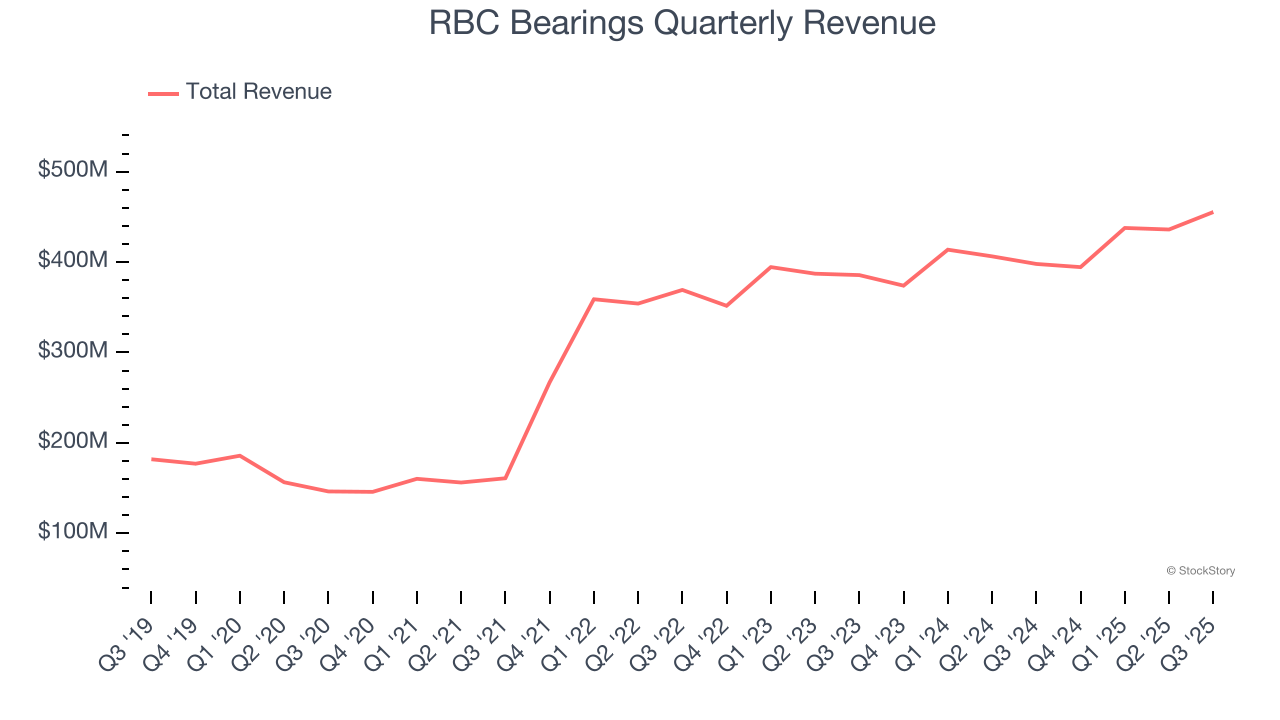
1. Skyrocketing Revenue Shows Strong Momentum
Reviewing a company’s long-term sales performance reveals insights into its quality. Any business can put up a good quarter or two, but the best consistently grow over the long haul. Over the last five years, RBC Bearings grew its sales at an incredible 21% compounded annual growth rate. Its growth beat the average industrials company and shows its offerings resonate with customers.
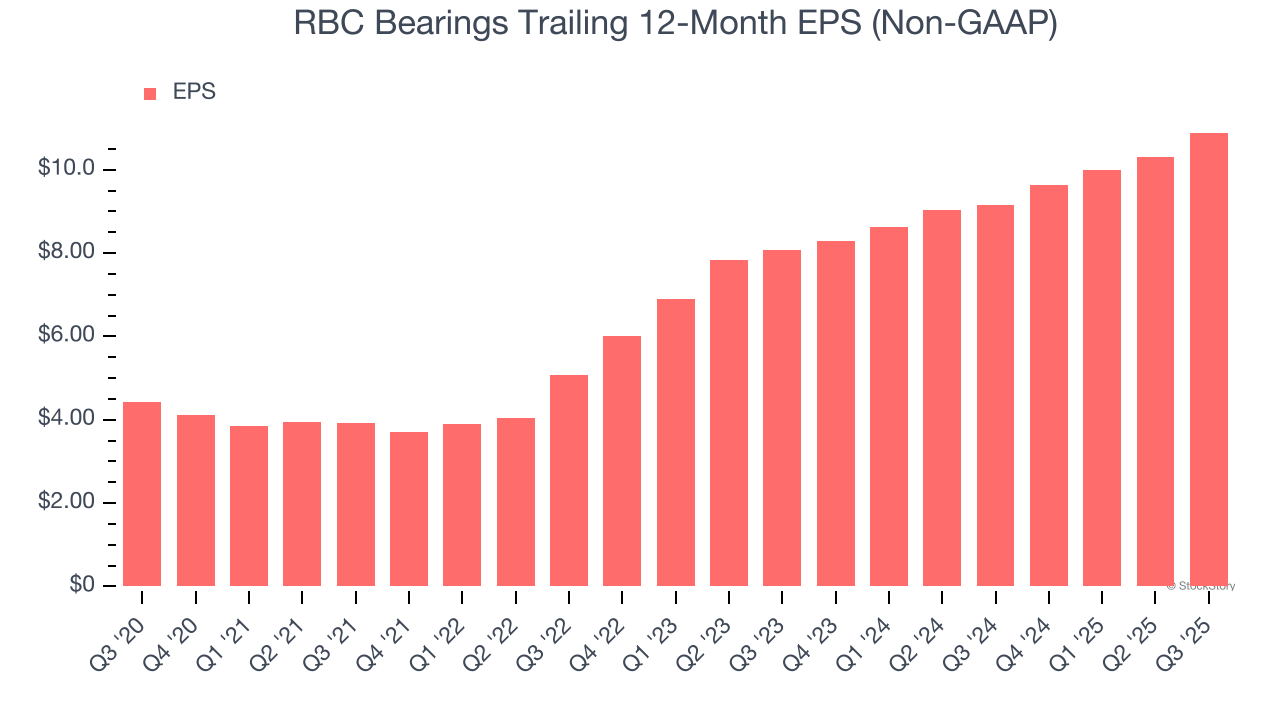
2. Outstanding Long-Term EPS Growth
We track the long-term change in earnings per share (EPS) because it highlights whether a company’s growth is profitable.
RBC Bearings’s astounding 19.7% annual EPS growth over the last five years aligns with its revenue performance. This tells us its incremental sales were profitable.
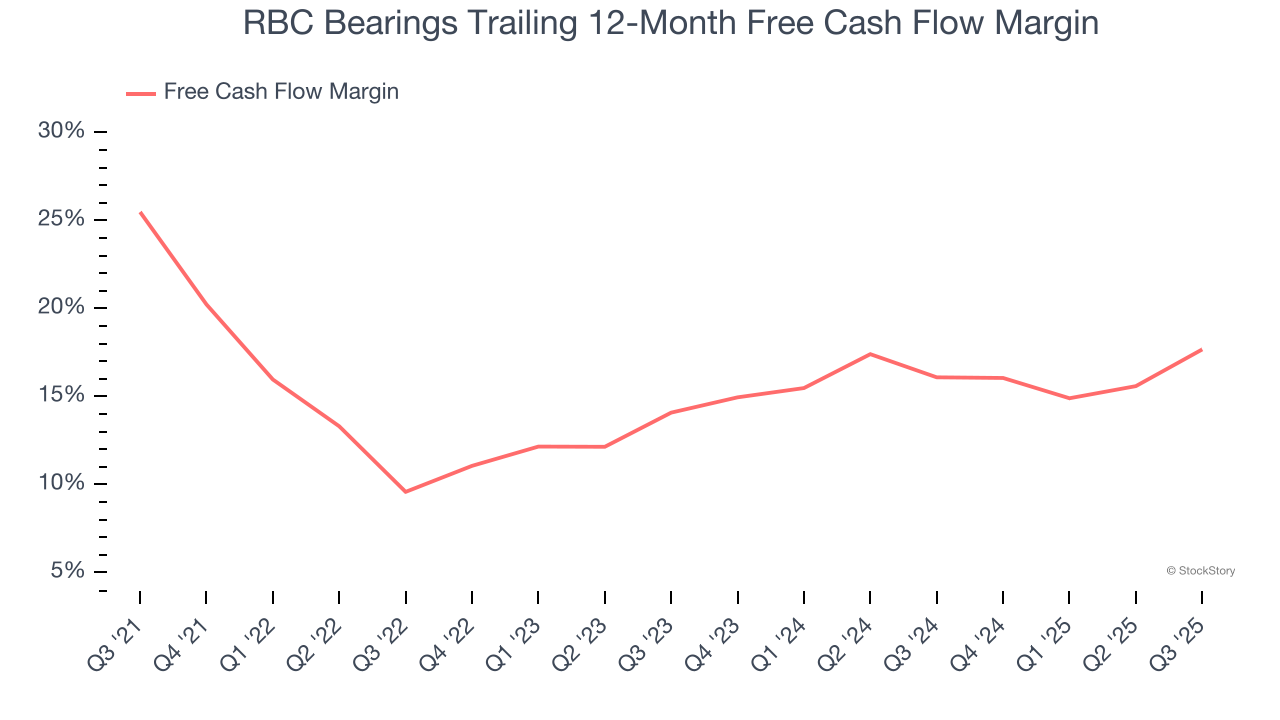
3. Excellent Free Cash Flow Margin Boosts Reinvestment Potential
Free cash flow isn't a prominently featured metric in company financials and earnings releases, but we think it's telling because it accounts for all operating and capital expenses, making it tough to manipulate. Cash is king.
RBC Bearings has shown terrific cash profitability, putting it in an advantageous position to invest in new products, return capital to investors, and consolidate the market during industry downturns. The company’s free cash flow margin was among the best in the industrials sector, averaging 15.6% over the last five years.
Final Judgment
These are just a few reasons RBC Bearings is a rock-solid business worth owning, and with its shares topping the market in recent months, the stock trades at 39.7× forward P/E (or $504.77 per share). Is now a good time to initiate a position? See for yourself in our comprehensive research report, it’s free.
Stocks We Like Even More Than RBC Bearings
If your portfolio success hinges on just 4 stocks, your wealth is built on fragile ground. You have a small window to secure high-quality assets before the market widens and these prices disappear.
Don’t wait for the next volatility shock. Check out our Top 5 Growth Stocks for this month. This is a curated list of our High Quality stocks that have generated a market-beating return of 244% over the last five years (as of June 30, 2025).
Stocks that have made our list include now familiar names such as Nvidia (+1,326% between June 2020 and June 2025) as well as under-the-radar businesses like the once-micro-cap company Tecnoglass (+1,754% five-year return). Find your next big winner with StockStory today.


