Learn How to Read These Smart Money Warning Signs as Commitments of Traders Data Comes Back Online
By:
Barchart.com
November 21, 2025 at 08:44 AM EST
When you look at a chart, you’re usually just seeing price. But behind every move, there’s a tug-of-war between different types of traders: hedgers, funds, speculators, and large institutions. The Commitments of Traders (COT) Report tells you who is positioned where – and when that positioning gets extreme, it can signal that a trend is getting tired. Don’t Miss a Day: From crude oil to coffee, sign up free for Barchart’s best-in-class commodity analysis.
In one of Barchart’s most popular YouTube webinars, Senior Market Strategist John Rowland, CMT, and commodities expert Don Dawson walk through how to use the COT report. They discuss the logic applied to commodities and equity index futures like the S&P 500 and Nasdaq, giving traders and investors a powerful “under-the-surface” view of the market. With the end of the government shutdown bringing COT data back online, now is a perfect time to take a closer look. What the COT Report Actually ShowsThe COT report is published weekly by the Commodity Futures Trading Commission (CFTC) and breaks down futures open interest by trader type. In simple terms, it tells you:
On Barchart, you can view this via:
These reports are (typically) updated every week and can be applied to commodities like soybeans, crude oil, and gold, as well as financial futures such as stock indices, currencies, and rates. 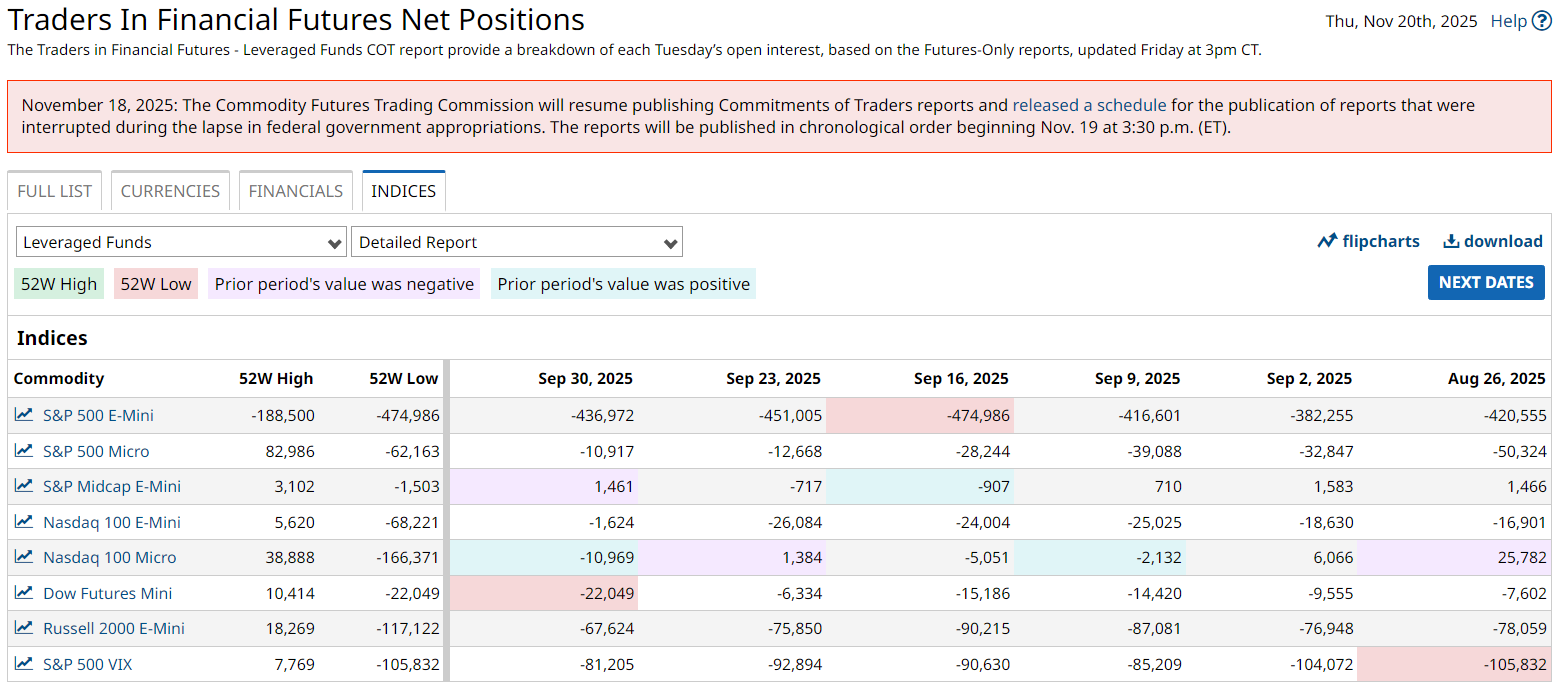
Soybeans Example: Why Managed Money MattersIn the clip, Don Dawson points out something important in the soybean meal COT chart: The Managed Money line (often shown in green) had been above zero, meaning funds were net long for an extended period. Managed money (CTAs, hedge funds, etc.) doesn’t trade like retail. They’re not scalping intraday; they often hold positions for 6–12 months at a time. Because of their size, frequent in-and-out trading would create huge transaction costs. So when they commit, they really commit. That tells you two things:
Position Limits, Commercials, and “Who’s on the Other Side?”John and Don also talk about position limits.
That said, in practice, commercials rarely hedge 100% of their exposure. John notes that in his experience, they might hedge around 50% of exposure, as opposed to all of it. When prices and speculative positioning get extreme, commercials often step in on the other side, taking advantage of attractive prices. From a trader’s point of view, when speculators are maxed out long and commercials are taking the other side, the risk of a trend change goes up. The COT report becomes a warning signal – not necessarily for immediate action, but for tightening risk and watching price action more closely. Using COT Logic on Equity Index FuturesYou don’t have to trade soybeans to use COT. For stock indexes, the CFTC publishes a version of the report called Traders in Financial Futures (TFF). Instead of “Commercial vs Non-Commercial,” it breaks participants into:
The same principles apply. When Leveraged Funds are extremely net long S&P or Nasdaq futures, and that positioning is near multi-year highs, you can ask:
When Leveraged Funds are extremely net short, it can signal capitulation or a potential contrarian long setup if price action starts to stabilize. Combine that with:
…and you’ve got a much deeper read than just interpreting a candlestick chart. How COT Helps Index Traders and InvestorsFor traders and investors in broad-based ETFs or indices, such as SPY, QQQ, and sector ETFs, COT can be a macro sentiment gauge. If Leveraged Funds are record net long S&P futures while RSI is overbought and breadth is deteriorating, it may be time to:
If they’re record net short into a washout and price starts to base, it might be time to:
It’s not about predicting the exact top or bottom; it’s about understanding how stretched the rubber band is. Bringing It All TogetherThe Commitments of Traders report is one of those tools that looks complicated at first, but once you understand the basic story — who’s long, who’s short, and who’s maxed out — it becomes a powerful backdrop to your technical and fundamental work. For futures traders, it can confirm trends and flag potential reversals in markets like soybeans, crude oil, gold, and rates. For equity index traders and investors, it provides a lens into how heavily leveraged funds and institutions are leaning into the current move. That’s where the real edge comes from — not just knowing where price is, but who’s behind the move. If you want to go deeper, check out this quick clip that breaks down the soybean example: Then, watch the full COT Webinar with John Rowland and Don Dawson, and open up Barchart’s COT Charts and COT Index study to analyze positioning across your favorite markets and indices. On the date of publication, Barchart Insights did not have (either directly or indirectly) positions in any of the securities mentioned in this article. All information and data in this article is solely for informational purposes. For more information please view the Barchart Disclosure Policy here.
More news from Barchart
More NewsView More
Via MarketBeat

Via MarketBeat
Tickers
LLY


D-Wave: Time to Buy the Dip? Or is the Fall Just Starting? ↗
November 24, 2025
Via MarketBeat
Tickers
QBTS
Hims, Block, and NRG Just Launched Huge Stock Buybacks ↗
November 24, 2025
Via MarketBeat
Recent QuotesView More
Stock Quote API & Stock News API supplied by www.cloudquote.io
Quotes delayed at least 20 minutes. By accessing this page, you agree to the Privacy Policy and Terms Of Service.
© 2025 FinancialContent. All rights reserved.
|