


Alibaba Group Holding Ltd (NY:BABA)
Price and Volume
Detailed Quote| Volume | 16,712,616 |
| Open | 86.18 |
| Bid (Size) | 85.30 (100) |
| Ask (Size) | 85.36 (500) |
| Prev. Close | 86.65 |
| Today's Range | 84.22 - 86.89 |
| 52wk Range | 84.22 - 181.10 |
| Shares Outstanding | 41,288,511 |
| Dividend Yield | 1.24% |
Top News
More News
Performance
52-Week Range
53.4% below 52-week high
84.37
84.2252W Low
181.1052W High
1 Week
12.0% below 1-week high
84.221W Low
95.921W High
Alibaba Group Holding Ltd (BABA) traded between $84.22 and $181.10 over the past 52 weeks and last traded at $84.37, 53.4% below its 52-week high. Over the past week it ranged between $84.22 and $95.92.
Past 12 Months
1W
-$9.99
1M
-$24.20
3M
-$44.53
6M
-$50.10
YTD
-$71.37
1Y
-$75.35
BABA was -47.2% over the past year, -37.3% over six months, -45.8% year to date, -10.6% in the last week.
12 Months vs Market
BABA
-47.2%
DIA
+8.8%
SPY
+10.6%
QQQ
+10.6%
IWM
+15.7%
Over the past 12 months BABA returned -47.2% versus DIA (Dow) +8.8%, SPY (S&P 500) +10.6%, QQQ (Nasdaq 100) +10.6% and IWM (Russell 2000) +15.7%.
Volume & Liquidity
1.57× 3-mo avg
Today 16,712,616
3-mo avg 10.6M
1W
16.9M
1M
11.2M
3M
10.6M
6M
11.1M
YTD
11.5M
1Y
11.3M
BABA most recently traded 16,712,616 shares against a 3-month average daily volume of 10.6M.
More News
Read More
ZTO Express (Cayman) Q3 Earnings Call Highlights ↗
November 17, 2026
Weibo (WB) Q3 2026 Earnings Call Transcript ↗
November 17, 2026

What Weibo (WB) Said on Its Q3 Earnings Call ↗
November 17, 2026
Should You Buy Alibaba Stock Before the Huge Investor Update? ↗
November 16, 2026

These 5 International ETFs Add Stocks From Outside the U.S. ↗
November 15, 2026


What Mueller Water Products (MWA) Said on Its Q4 Earnings Call ↗
November 08, 2026
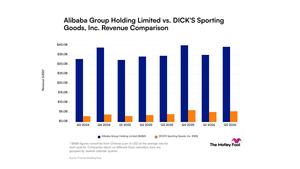

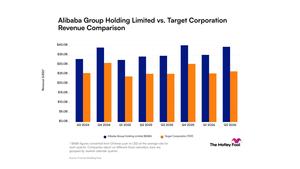
Alibaba vs. Target: Comparing Revenue Trends Between Two Retail Titans ↗
November 02, 2026

RealReal Q3 Earnings Call Highlights ↗
October 29, 2026


Alibaba vs. Target: Which Consumer Stock Is a Better Buy in 2026? ↗
October 27, 2026

Frequently Asked Questions
Is Alibaba Group Holding Ltd publicly traded?
Yes, Alibaba Group Holding Ltd is publicly traded.
What exchange does Alibaba Group Holding Ltd trade on?
Alibaba Group Holding Ltd trades on the New York Stock Exchange
What is the ticker symbol for Alibaba Group Holding Ltd?
The ticker symbol for Alibaba Group Holding Ltd is BABA on the New York Stock Exchange
What is the current price of Alibaba Group Holding Ltd?
The current price of Alibaba Group Holding Ltd is 84.37
When was Alibaba Group Holding Ltd last traded?
The last trade of Alibaba Group Holding Ltd was at 11/18/26 07:00 PM ET
What is the market capitalization of Alibaba Group Holding Ltd?
The market capitalization of Alibaba Group Holding Ltd is 3.48B
How many shares of Alibaba Group Holding Ltd are outstanding?
Alibaba Group Holding Ltd has 3B shares outstanding.
Stock Quote API & Stock News API supplied by www.cloudquote.io
Quotes delayed at least 20 minutes.
By accessing this page, you agree to the Privacy Policy and Terms Of Service.
Quotes delayed at least 20 minutes.
By accessing this page, you agree to the Privacy Policy and Terms Of Service.
© 2025 FinancialContent. All rights reserved.
© Copyright 2015, Penticton Herald, Penticton, BC. Powered by BLOX Content Management System from TownNews.com.