Skip to content
Who We Serve
Private Wealth
Firefighters (FirefightersUnited™)
Police (911 Financial Services™)
Government Employees
About Us
Our Team
Our Story
Investment Strategies
Who We Serve
Private Wealth
Firefighters (FirefightersUnited™)
Police (911 Financial Services™)
Government Employees
About Us
Our Team
Our Story
Investment Strategies
Private Wealth
Firefighters (FirefightersUnited™)
Police (911 Financial Services™)
Government Employees (911 Financial Services™)
Our Story
Our Team
Investment Strategies
Contact Us
Schwab Client Login
Private Wealth
Firefighters (FirefightersUnited™)
Police (911 Financial Services™)
Government Employees (911 Financial Services™)
Our Story
Our Team
Investment Strategies
Contact Us
Schwab Client Login
Contact Us
Schwab Client Login
Recent Quotes
View Full List
My Watchlist
Create Watchlist
Indicators
DJI
Nasdaq Composite
SPX
Gold
Crude Oil
Markets
Stocks
ETFs
Tools
Markets:
Overview
News
Currencies
International
Treasuries
Restaurant Brands International Inc. Common Shares
(NY:
QSR
)
70.95
+0.29 (+0.41%)
Official Closing Price
Updated: 7:00 PM EDT, Oct 9, 2026
Add to My Watchlist
Quote
Overview
Detailed Quote
Charting
Historical Prices
News
Press Releases
Research
Quarterly Reports
Insider Filings
Other Filings
All News about Restaurant Brands International Inc. Common Shares
< Previous
1
2
3
4
5
6
7
8
9
...
24
25
Next >
2 Mid-Cap Stocks to Target This Week and 1 We Ignore
Today 0:33 EDT
Many investors pay attention to mid-cap stocks because they have established business models and expansive market opportunities. However, their paths to beco...
Via
StockStory
1 Safe-and-Steady Stock for Long-Term Investors and 2 That Underwhelm
October 06, 2026
A stock with low volatility can be reassuring, but it doesn’t always mean strong long-term performance. Investors who prioritize stability may miss out on hi...
Via
StockStory
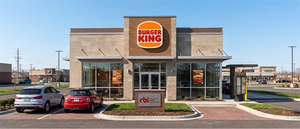
Burger King Is Eating McDonald's Lunch. Here's What the Golden Arches Need to Do Now.
↗
September 26, 2026
In the race to lure customers back to stores, McDonald's needs to evaluate what Restaurant Brands is doing right.
Via
The Motley Fool
1 Profitable Stock to Target This Week and 2 Facing Headwinds
September 23, 2026
Not all profitable companies are built to last - some rely on outdated models or unsustainable advantages. Just because a business is in the green today does...
Via
StockStory
Restaurant Brands International (NYSE:QSR) Rallies on Q2 Earnings Beat and Reaffirmed Outlook
↗
August 06, 2026
Via
Chartmill
Topics
Earnings
The Fed Hiked Interest Rates for the First Time in 3 Years to Slow Down Inflation and Deliver Price Stability. Here’s What That Means for Restaurant Stocks.
↗
September 17, 2026
In an industry that's already under pressure, there will be winners. But what criteria separate the winners from the rest?
Via
The Motley Fool
Topics
Economy
World Trade
Should You Avoid Wendy's Stock, Even After a 66% Decline?
↗
September 17, 2026
Wendy's new CEO laid out his vision to improve results.
Via
The Motley Fool
2 Cash-Producing Stocks with Promising Prospects and 1 We Brush Off
September 11, 2026
A company that generates cash isn’t automatically a winner. Some businesses stockpile cash but fail to reinvest wisely, limiting their ability to expand. Luc...
Via
StockStory
Why Franchise Models Are Winning the Restaurant Stock Divide
↗
September 07, 2026
QSR and Yum! Brands posted strong Q2 2026 results on franchise economics and global diversification, while McDonald's U.S. sales slowed on execution missteps despite similar franchise strength.
Via
MarketBeat
Bill Ackman Says Pershing Square Has Achieved a 20% Gross Annual Return Since Inception and Aims to Keep Beating That Bar. Can His Newly Launched Funds Live Up to the Track Record?
↗
September 04, 2026
Ackman is about to embark on a new venture.
Via
The Motley Fool
Topics
Initial Public Offering
2 Restaurant Stocks Worth Investigating and 1 Facing Challenges
September 03, 2026
Restaurants are go-to meeting hubs for friends, family, and colleagues. But it’s not all sunshine and rainbows as they’re notoriously hard to run thanks to p...
Via
StockStory
2 Unpopular Stocks That Deserve a Second Chance and 1 We Ignore
August 24, 2026
When Wall Street turns bearish on a stock, it’s worth paying attention. These calls stand out because analysts rarely issue grim ratings on companies for fea...
Via
StockStory
Burger King's $700 Million Fix Is Paying Off for Restaurant Brands International
↗
August 20, 2026
Tim Hortons' business is cooling off just as Burger King is starting to pull its weight.
Via
The Motley Fool
Restaurant Brands (QSR): Buy, Sell, or Hold Post Q2 Earnings?
August 17, 2026
Restaurant Brands has followed the market’s trajectory closely, rising in tandem with the S&P 500 over the past six months. The stock has climbed by 14% to $...
Via
StockStory
Topics
Stocks
Restaurant Brands (QSR) Q2 2026 Earnings Call Transcript
↗
August 13, 2026
Burger King U.S. surges past industry peers as Tim Hortons Canada faces headwinds.
Via
The Motley Fool
Topics
Earnings
Restaurant Brands’s Q2 Earnings Call: Our Top 5 Analyst Questions
August 13, 2026
Restaurant Brands’ second quarter results reflected steady execution across its multi-brand portfolio, with particular strength from Burger King and internat...
Via
StockStory
Topics
Earnings
Is Wingstop's Growth Story Losing Steam?
↗
August 10, 2026
Wingstop shares have dropped 66% from their 52-week high even as revenue and earnings keep rising, as declining domestic same-store sales and rising debt weigh on the stock.
Via
MarketBeat
Meet the High-Yield Dividend Stock Bill Ackman Has Owned for Over a Decade. Here's Why It's a Great Buy in August.
↗
August 09, 2026
The Burger King parent company has some momentum.
Via
The Motley Fool
Restaurant Brands International Q2 Earnings Call Highlights
↗
August 08, 2026
Restaurant Brands International (NYSE:QSR) reported second-quarter results that showed continued sales and earnings growth, led by Burger King U.S. and its international operations, while Tim Hortons...
Via
MarketBeat
Topics
Earnings
QSR Q2 Deep Dive: Balanced Global Growth and Burger King Momentum Drive Results
August 07, 2026
Fast-food company Restaurant Brands (NYSE:QSR) met Wall Street’s revenue expectations in Q2 CY2026, with sales up 4.6% year on year to $2.52 billion. Its non...
Via
StockStory
Bill Ackman's 7-Stock Portfolio Is Quietly Beating the Market. Here's What's Inside It.
↗
August 06, 2026
Its performance may be volatile, but it's certainly working well enough right now.
Via
The Motley Fool
Restaurant Brands (NYSE:QSR) Reports Q2 CY2026 In Line With Expectations
August 06, 2026
Fast-food company Restaurant Brands (NYSE:QSR) met Wall Street’s revenue expectations in Q2 CY2026, with sales up 4.6% year on year to $2.52 billion. Its non...
Via
StockStory
Topics
Supply Chain
Restaurant Brands (QSR) To Report Earnings Tomorrow: Here Is What To Expect
August 04, 2026
Fast-food company Restaurant Brands (NYSE:QSR) will be reporting results this Thursday before the bell. Here’s what to expect. Restaurant Brands beat analyst...
Via
StockStory
3 Reasons to Sell QSR and 1 Stock to Buy Instead
July 07, 2026
Restaurant Brands trades at $72.95 per share and has stayed right on track with the overall market, gaining 8.1% over the last six months. At the same time, ...
Via
StockStory
MarketBeat Week in Review – 06/29 - 07/03
↗
July 04, 2026
MarketBeat's weekly roundup covers a weaker June jobs report, tech sector rotation, and top analyst picks including TSLA, AVGO, PLTR, MRNA, and NEE heading into Q2 earnings season.
Via
MarketBeat
Topics
Artificial Intelligence
Why Restaurant Brands (QSR) Stock Is Up Today
July 02, 2026
What Happened? Shares of fast-food company Restaurant Brands (NYSE:QSR) jumped 3.2% in the morning session after a report on U.S. restaurant traffic for late...
Via
StockStory
Topics
Artificial Intelligence
Economy
World Trade
Burger King’s Turnaround Is Putting Restaurant Brands Back in Focus
↗
July 01, 2026
Restaurant Brands International posted Q1 2026 revenue of $2.26 billion and EPS of 86 cents, as Burger King U.S. comparable sales surged 5.8% amid its ongoing turnaround.
Via
MarketBeat
1 Mid-Cap Stock on Our Buy List and 2 We Avoid
June 29, 2026
Mid-cap stocks often strike the right balance between having proven business models and market opportunities that can support $100 billion corporations. Howe...
Via
StockStory
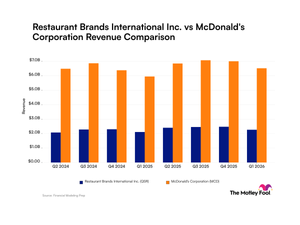
Restaurant Brands International vs. McDonald's: Comparing Revenue Trends for These Fast-Food Giants
↗
June 27, 2026
Quarterly revenue for both companies follows a striking seasonal rhythm, but their profit margins and global scale reveal key differences.
Via
The Motley Fool
Topics
Economy
Spotting Winners: Restaurant Brands (NYSE:QSR) And Traditional Fast Food Stocks In Q1
June 22, 2026
As the Q1 earnings season wraps, let’s dig into this quarter’s best and worst performers in the traditional fast food industry, including Restaurant Brands (...
Via
StockStory
< Previous
1
2
3
4
5
6
7
8
9
...
24
25
Next >
Stock Quote API & Stock News API supplied by
www.cloudquote.io
Quotes delayed at least 20 minutes.
By accessing this page, you agree to the
Privacy Policy
and
Terms Of Service
.
© 2025 FinancialContent. All rights reserved.