Menu
home
about us
Investment Approach
Client Service Approach
Market Analysis Summary
Mission Statement
Value Proposition
Team Biographies
Firm ADV PDFs
Form CRS
Firm Brochure-Part 2A of Form ADV
Brochure Supplement Amit Stavinsky
Brochure Supplement Frank Parks
Brochure Supplement Dominick Savo
Brochure Supplement Richard Mason
Brochure Supplement Joe Estes
Brochure Supplement Jonathan Ezra
Statement Of Financial Strength
Job Opportunities
Tamar Advisors
Own Your Practice
Letter to Clients
member log-in
contact us
PRODUCTS
Fixed Income Portfolio (FIP)
FIP Program
Services, Fees and Compensation
Client Information
Client Contact with Portfolio Manager(s)
Sample Portfolio
Back Dated Performance Reports
Quarterly Performance Reports
Total Asset Market (TAM)
TAM sm Program
Services, Fees and Compensation
Client Information
Client Contact with Portfolio Manager(s)
Sample Portfolio
Back Dated Performance Reports
Quarterly Performance Reports
Total Asset Fund (TAF)
TAF sm Program
Services, Fees and Compensation
Client Information
Client Contact with Portfolio Manager(s)
Sample Portfolio
Back Dated Performance Reports
Quarterly Performance Reports
Market Value Securities (MVS)
MVS Program
Services, Fees and Compensation
Client Information
Client Contact with Portfolio Manager(s)
Sample Portfolio
Back Dated Performance Reports
Quarterly Performance Reports
Total Asset Value (TAV)
TAV Program
Services, Fees and Compensation
Client Information
Client Contact with Portfolio Manager(s)
Sample Portfolio
Back Dated Performance Reports
Quarterly Performance Reports
Municipal Bonds
Taxable Bonds
Par, Premium, and Discount Bonds
Rating and Analyzing Bonds
Refunding & Pre-refunding
Bond Yields
Yield Curve
Secured Bonds
Mortgage Bonds
Unsecured Bonds
Debentures
Subordinated Debentures
Zero-Coupon Bonds
Convertible Bonds
High Yield Dividend Stocks
Independent Money Managers
Fees & Compensation
Corporate Cash Management
Fees & Compensation
Estate Planning
Financial Planning
Client Service Approach
Client's Responsibilities
Fees
Implementation
Legal Services
Termination
Professional Alliance Network
Client Service Approach
Client's Responsibilities
Fees
Implementation
Legal Services
Termination
MUNICIPAL BONDS
Municipal Bond Presentation
About Us
The Management
Global Asset Allocation Products
FIP Program
Classifying Municipal Bonds
Revenue Bonds
Credit Factors Affecting General Obligation Bonds
Credit Factors Affecting the Quality of Local Municipal Bonds
Analyzing the Credit Quality of General Obligation Bonds
Analyzing the Credit Quality of Revenue Municipal Bonds
What We Buy Currently
What We Normally Don’t Buy
Municipal Bonds – Unique Asset Class
Default Rates
Yield Difference
Turnkey Operation Platform
Advantages of Our Bid Wanted System
Advantages of Our Clearing System
Preferred Custodian Settlement
Advantages of Same-Day Allocation
TSL’s Turnkey Operation Platform
Sample Portfolio
Sample Portfolio Analysis
Classifying Municipal Bonds
Revenue Municipal Bonds
Types of Revenue Municipal Bonds
Industrial Development Revenue Bonds
Lease-back Bonds
Special Tax Bonds
NHA/PHA Bonds
Moral Obligation Bonds
Municipal Notes
TANs/RANs
BANs
CLNs/GANs
Variable Rate Bonds/Notes
Build America Bonds
Double-Barreled Bonds
Bond Index Components
Open-end-Closed-end-Indenture
Sinking Fund
Bond Contracts
Bond Indenture
Official Statement
Bond Issuance Process
Analyzing GO Bonds
Analyzing Revenue Bonds
Debt Ratios
General Price Analysis of Municipal Bonds
Liquidity
Interest Rate Risk
Credit Risk
Coupon Risk
Maturity Risk
Municipal Bond Insurance
Municipal Bonds Unique Asset Class
Default Rates
What We Buy Currently
What We Normally Don’t Buy
Turnkey Operation Platform
Advantages of Our Bid Wanted System
Advantages of Our Clearing System
Preferred Custodian Settlement
Advantages of Same Day Allocation
Traditional Broker/Dealer Execution Flow
TSL's Turnkey Operation Platform
INDEX FUNDS
Total Asset Fund (TAF)
TAF sm Program
Services, Fees and Compensation
Account Requirements
Client Information
Client Contact with Portfolio Manager(s)
Additional Information
Sample Portfolio
Back Dated Performance Reports
Quarterly Performance Reports
EVENTS
FIP
Event Schedule
Municipal Bond Presentation
TAM
Event Schedule
Total Asset Market (TAM sm) Presentation
TAF
Event Schedule
Total Asset Fund (TAF sm) Presentation
MVS
Event Schedule
Market Value Securities (MVS sm) Presentation
Featured Event
Calendar of Events
Events History
Investing During Uncertain Times
Read FULL Seminar Here
Tax-Free Income Seminar
Bond Fund Seminar
RSVP-Signup Form
MARKET RESEARCH
Featured Quarterly Newsletter
Featured Articles
Contrarian Notes Blog
home
about us
Investment Approach
Client Service Approach
Market Analysis Summary
Mission Statement
Value Proposition
Team Biographies
Firm ADV PDFs
Form CRS
Firm Brochure-Part 2A of Form ADV
Brochure Supplement Amit Stavinsky
Brochure Supplement Frank Parks
Brochure Supplement Dominick Savo
Brochure Supplement Richard Mason
Brochure Supplement Joe Estes
Brochure Supplement Jonathan Ezra
Statement Of Financial Strength
Job Opportunities
Tamar Advisors
Own Your Practice
Letter to Clients
member log-in
contact us
PRODUCTS
Fixed Income Portfolio (FIP)
FIP Program
Services, Fees and Compensation
Client Information
Client Contact with Portfolio Manager(s)
Sample Portfolio
Back Dated Performance Reports
Quarterly Performance Reports
Total Asset Market (TAM)
TAM sm Program
Services, Fees and Compensation
Client Information
Client Contact with Portfolio Manager(s)
Sample Portfolio
Back Dated Performance Reports
Quarterly Performance Reports
Total Asset Fund (TAF)
TAF sm Program
Services, Fees and Compensation
Client Information
Client Contact with Portfolio Manager(s)
Sample Portfolio
Back Dated Performance Reports
Quarterly Performance Reports
Market Value Securities (MVS)
MVS Program
Services, Fees and Compensation
Client Information
Client Contact with Portfolio Manager(s)
Sample Portfolio
Back Dated Performance Reports
Quarterly Performance Reports
Total Asset Value (TAV)
TAV Program
Services, Fees and Compensation
Client Information
Client Contact with Portfolio Manager(s)
Sample Portfolio
Back Dated Performance Reports
Quarterly Performance Reports
Municipal Bonds
Taxable Bonds
Par, Premium, and Discount Bonds
Rating and Analyzing Bonds
Refunding & Pre-refunding
Bond Yields
Yield Curve
Secured Bonds
Mortgage Bonds
Unsecured Bonds
Debentures
Subordinated Debentures
Zero-Coupon Bonds
Convertible Bonds
High Yield Dividend Stocks
Independent Money Managers
Fees & Compensation
Corporate Cash Management
Fees & Compensation
Estate Planning
Financial Planning
Client Service Approach
Client's Responsibilities
Fees
Implementation
Legal Services
Termination
Professional Alliance Network
Client Service Approach
Client's Responsibilities
Fees
Implementation
Legal Services
Termination
MUNICIPAL BONDS
Municipal Bond Presentation
About Us
The Management
Global Asset Allocation Products
FIP Program
Classifying Municipal Bonds
Revenue Bonds
Credit Factors Affecting General Obligation Bonds
Credit Factors Affecting the Quality of Local Municipal Bonds
Analyzing the Credit Quality of General Obligation Bonds
Analyzing the Credit Quality of Revenue Municipal Bonds
What We Normally Buy
What We Normally Don’t Buy
Municipal Bonds – Unique Asset Class
Default Rates
Yield Difference
Turnkey Operation Platform
Advantages of Our Bid Wanted System
Advantages of Our Clearing System
Preferred Custodian Settlement
Advantages of Same-Day Allocation
TSL’s Turnkey Operation Platform
Classifying Municipal Bonds
Revenue Municipal Bonds
Types of Revenue Municipal Bonds
Industrial Development Revenue Bonds
Lease-back Bonds
Special Tax Bonds
NHA/PHA Bonds
Moral Obligation Bonds
Municipal Notes
TANs/RANs
BANs
CLNs/GANs
Variable Rate Bonds/Notes
Build America Bonds
Double-Barreled Bonds
Bond Index Components
Open-end-Closed-end-Indenture
Sinking Fund
Bond Contracts
Bond Indenture
Official Statement
Bond Issuance Process
Analyzing GO Bonds
Analyzing Revenue Bonds
Debt Ratios
General Price Analysis of Municipal Bonds
Liquidity
Interest Rate Risk
Credit Risk
Coupon Risk
Maturity Risk
Municipal Bond Insurance
Municipal Bonds Unique Asset Class
Default Rates
What We Buy Currently
What We Normally Don’t Buy
Turnkey Operation Platform
Advantages of Our Bid Wanted System
Advantages of Our Clearing System
Preferred Custodian Settlement
Advantages of Same Day Allocation
Traditional Broker/Dealer Execution Flow
TSL's Turnkey Operation Platform
INDEX FUNDS
Total Asset Fund (TAF)
TAF® Program
Services, Fees and Compensation
Client Information
Client Contact with Portfolio Manager(s)
Additional Information
Sample Portfolio
Back Dated Performance Reports
Quarterly Performance Reports
EVENTS
FIP
Event Schedule
TAM
Event Schedule
Total Asset Market (TAM sm) Presentation
TAF
Event Schedule
Total Asset Fund (TAF sm) Presentation
MVS
Event Schedule
Market Value Securities (MVS sm) Presentation
Featured Event
Calendar of Events
Events History
Investing During Uncertain Times
Read FULL Seminar Here
Tax-Free Income Seminar
Bond Fund Seminar
RSVP-Signup Form
MARKET RESEARCH
Featured Quarterly Newsletter
Featured Articles
Contrarian Notes Blog
Recent Quotes
View Full List
My Watchlist
Create Watchlist
Indicators
DJI
Nasdaq Composite
SPX
Gold
Crude Oil
Markets
Stocks
ETFs
Tools
Markets:
Overview
News
Currencies
International
Treasuries
Eli Lilly
(NY:
LLY
)
862.86
+18.36 (+2.17%)
Official Closing Price
Updated: 7:00 PM EDT, Oct 31, 2025
Add to My Watchlist
Quote
Overview
Detailed Quote
Charting
Historical Prices
News
Press Releases
Research
Quarterly Reports
Insider Filings
Other Filings
Price and Volume
Detailed Quote
Volume
5,015,041
Open
839.16
Bid (Size)
864.00 (4)
Ask (Size)
864.50 (1)
Prev. Close
844.50
Today's Range
834.19 - 869.91
52wk Range
623.78 - 935.62
Shares Outstanding
956,580,893
Dividend Yield
0.70%
Intraday
1 Week
1 Month
3 Month
1 Year
3 Year
5 Year
Top News
More News
Why Bio-Techne (TECH) Stock Is Up Today
October 31, 2025
Shares of life sciences company Bio-Techne (NASDAQ:TECH) jumped 2.8% in the afternoon session after Baird adjusted its price target on the company, signaling a more positive outlook. The investment...
Via
StockStory
Topics
Artificial Intelligence
Supply Chain
World Trade
Eli Lilly Seen In 'Pole Position' For Growth, Analysts Say
October 31, 2025
Eli Lilly shares rise as Q3 revenue jumps 54% to $17.6 billion, earnings top estimates, and analysts lift price targets on strong obesity drug momentum.
Via
Benzinga
Performance
YTD
+10.9%
+10.9%
1 Month
+4.5%
+4.5%
3 Month
+13.2%
+13.2%
6 Month
+4.8%
+4.8%
1 Year
+4.0%
+4.0%
More News
Read More
AI Revolutionizes Pharma: Smarter Excipients for Safer, More Potent Drugs
October 31, 2025
Via
TokenRing AI
Topics
Artificial Intelligence
Supply Chain
AI Revolutionizes Pharma R&D: A New Era of Accelerated Drug Discovery and Personalized Medicine
October 31, 2025
Via
TokenRing AI
Topics
Artificial Intelligence
Intellectual Property
AI: The Pharmaceutical Sector’s New Catalyst for a Healthier Future
October 31, 2025
Via
TokenRing AI
Topics
Animal Testing
Artificial Intelligence
Economy
Why iRhythm (IRTC) Stock Is Trading Up Today
October 31, 2025
Via
StockStory
Topics
Artificial Intelligence
World Trade
Here's Why Avidity Biosciences Stock Soared This Week (There's More to the Deal Than You Might Think)
October 31, 2025
Via
The Motley Fool
Meta Meltdown Sends Nasdaq Tumbling as Apple Shines After Hours
October 31, 2025
Via
Chartmill
Topics
Economy
Viking Therapeutics Stock Powers Toward Best Month Of The Year — Wall Street, Retail Bulls Fired Up On Obesity Drug Promise
October 31, 2025
Via
Stocktwits
1 Healthcare Stock with Impressive Fundamentals and 2 We Ignore
October 31, 2025
Via
StockStory
Topics
Stocks
Twilio Stock Rises On Q3 Earnings Beat, Raised Guidance
October 30, 2025
Via
Investor's Business Daily
Topics
Artificial Intelligence
Earnings
Cloudflare Earnings Top Estimates. Revenue Outlook Above Views.
October 30, 2025
Via
Investor's Business Daily
Topics
Artificial Intelligence
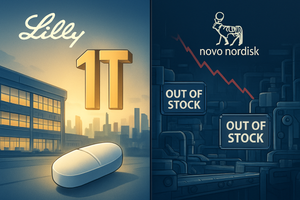
Eli Lilly Extends Lead In $150B Obesity Drug Race As Novo, Pfizer Clash — Here's How ETFs Stand To Gain
October 30, 2025
Via
Benzinga
Topics
ETFs
'Our GPUs Are Everywhere’ According to CEO Jensen Huang as Nvidia Doubles Down on AI, Quantum, and 6G
October 30, 2025
Via
Barchart.com
Topics
Artificial Intelligence
Eli Lilly (LLY) Stock Trades Up, Here Is Why
October 30, 2025
Via
StockStory
Topics
Artificial Intelligence
Economy
Government
Meta Tumbles 10%, Google Marks Historic Rally: What's Moving Markets Thursday?
October 30, 2025
Via
Benzinga
Topics
Economy
10 Health Care Stocks Whale Activity In Today's Session
October 30, 2025
Via
Benzinga
Novo Nordisk Kicks Off Bloody Battle With Pfizer, Bidding $6.5 Billion On Metsera
October 30, 2025
Via
Investor's Business Daily
Topics
Economy
Government
Nvidia's $5 Trillion Milestone Turns These AI ETFs Into Hot Trades
October 30, 2025
Via
Benzinga
Topics
Artificial Intelligence
ETFs
Tech Titans Tumble, Alphabet Soars as Market Opens Mixed on AI Spending Jitters
October 30, 2025
Via
MarketMinute
Topics
Artificial Intelligence
Economy
Fraud
Eli Lilly (LLY) Q3 2025 Earnings Call Transcript
October 30, 2025
Via
The Motley Fool
Topics
Earnings
Eli Lilly CEO Dave Ricks Reportedly Says Company Eyeing Pain Relief Market With Weight Loss Drug Retatrutide
October 30, 2025
Via
Stocktwits
Navigating the Currents: Dow Jones Shows Resilience Amidst Fed's Caution and Geopolitical Shifts
October 30, 2025
Via
MarketMinute
Topics
Artificial Intelligence
Economy
Government
Mounjaro And Zepbound Power Eli Lilly's 54% Revenue Jump In Q3, Hikes 2025 Forecast
October 30, 2025
Via
Benzinga
Unpacking the Latest Options Trading Trends in Eli Lilly
October 30, 2025
Via
Benzinga
Frequently Asked Questions
Is Eli Lilly publicly traded?
Yes, Eli Lilly is publicly traded.
What exchange does Eli Lilly trade on?
Eli Lilly trades on the New York Stock Exchange
What is the ticker symbol for Eli Lilly?
The ticker symbol for Eli Lilly is LLY on the New York Stock Exchange
What is the current price of Eli Lilly?
The current price of Eli Lilly is 862.86
When was Eli Lilly last traded?
The last trade of Eli Lilly was at 10/31/25 07:00 PM ET
What is the market capitalization of Eli Lilly?
The market capitalization of Eli Lilly is 825.40B
How many shares of Eli Lilly are outstanding?
Eli Lilly has 825B shares outstanding.
Stock Quote API & Stock News API supplied by
www.cloudquote.io
Quotes delayed at least 20 minutes.
By accessing this page, you agree to the
Privacy Policy
and
Terms Of Service
.
© 2025 FinancialContent. All rights reserved.