Menu
home
about us
Investment Approach
Client Service Approach
Market Analysis Summary
Mission Statement
Value Proposition
Team Biographies
Firm ADV PDFs
Form CRS
Firm Brochure-Part 2A of Form ADV
Brochure Supplement Amit Stavinsky
Brochure Supplement Frank Parks
Brochure Supplement Dominick Savo
Brochure Supplement Richard Mason
Brochure Supplement Joe Estes
Brochure Supplement Jonathan Ezra
Statement Of Financial Strength
Job Opportunities
Tamar Advisors
Own Your Practice
Letter to Clients
member log-in
contact us
PRODUCTS
Fixed Income Portfolio (FIP)
FIP Program
Services, Fees and Compensation
Client Information
Client Contact with Portfolio Manager(s)
Sample Portfolio
Back Dated Performance Reports
Quarterly Performance Reports
Total Asset Market (TAM)
TAM sm Program
Services, Fees and Compensation
Client Information
Client Contact with Portfolio Manager(s)
Sample Portfolio
Back Dated Performance Reports
Quarterly Performance Reports
Total Asset Fund (TAF)
TAF sm Program
Services, Fees and Compensation
Client Information
Client Contact with Portfolio Manager(s)
Sample Portfolio
Back Dated Performance Reports
Quarterly Performance Reports
Market Value Securities (MVS)
MVS Program
Services, Fees and Compensation
Client Information
Client Contact with Portfolio Manager(s)
Sample Portfolio
Back Dated Performance Reports
Quarterly Performance Reports
Total Asset Value (TAV)
TAV Program
Services, Fees and Compensation
Client Information
Client Contact with Portfolio Manager(s)
Sample Portfolio
Back Dated Performance Reports
Quarterly Performance Reports
Municipal Bonds
Taxable Bonds
Par, Premium, and Discount Bonds
Rating and Analyzing Bonds
Refunding & Pre-refunding
Bond Yields
Yield Curve
Secured Bonds
Mortgage Bonds
Unsecured Bonds
Debentures
Subordinated Debentures
Zero-Coupon Bonds
Convertible Bonds
High Yield Dividend Stocks
Independent Money Managers
Fees & Compensation
Corporate Cash Management
Fees & Compensation
Estate Planning
Financial Planning
Client Service Approach
Client's Responsibilities
Fees
Implementation
Legal Services
Termination
Professional Alliance Network
Client Service Approach
Client's Responsibilities
Fees
Implementation
Legal Services
Termination
MUNICIPAL BONDS
Municipal Bond Presentation
About Us
The Management
Global Asset Allocation Products
FIP Program
Classifying Municipal Bonds
Revenue Bonds
Credit Factors Affecting General Obligation Bonds
Credit Factors Affecting the Quality of Local Municipal Bonds
Analyzing the Credit Quality of General Obligation Bonds
Analyzing the Credit Quality of Revenue Municipal Bonds
What We Buy Currently
What We Normally Don’t Buy
Municipal Bonds – Unique Asset Class
Default Rates
Yield Difference
Turnkey Operation Platform
Advantages of Our Bid Wanted System
Advantages of Our Clearing System
Preferred Custodian Settlement
Advantages of Same-Day Allocation
TSL’s Turnkey Operation Platform
Sample Portfolio
Sample Portfolio Analysis
Classifying Municipal Bonds
Revenue Municipal Bonds
Types of Revenue Municipal Bonds
Industrial Development Revenue Bonds
Lease-back Bonds
Special Tax Bonds
NHA/PHA Bonds
Moral Obligation Bonds
Municipal Notes
TANs/RANs
BANs
CLNs/GANs
Variable Rate Bonds/Notes
Build America Bonds
Double-Barreled Bonds
Bond Index Components
Open-end-Closed-end-Indenture
Sinking Fund
Bond Contracts
Bond Indenture
Official Statement
Bond Issuance Process
Analyzing GO Bonds
Analyzing Revenue Bonds
Debt Ratios
General Price Analysis of Municipal Bonds
Liquidity
Interest Rate Risk
Credit Risk
Coupon Risk
Maturity Risk
Municipal Bond Insurance
Municipal Bonds Unique Asset Class
Default Rates
What We Buy Currently
What We Normally Don’t Buy
Turnkey Operation Platform
Advantages of Our Bid Wanted System
Advantages of Our Clearing System
Preferred Custodian Settlement
Advantages of Same Day Allocation
Traditional Broker/Dealer Execution Flow
TSL's Turnkey Operation Platform
INDEX FUNDS
Total Asset Fund (TAF)
TAF sm Program
Services, Fees and Compensation
Account Requirements
Client Information
Client Contact with Portfolio Manager(s)
Additional Information
Sample Portfolio
Back Dated Performance Reports
Quarterly Performance Reports
EVENTS
FIP
Event Schedule
Municipal Bond Presentation
TAM
Event Schedule
Total Asset Market (TAM sm) Presentation
TAF
Event Schedule
Total Asset Fund (TAF sm) Presentation
MVS
Event Schedule
Market Value Securities (MVS sm) Presentation
Featured Event
Calendar of Events
Events History
Investing During Uncertain Times
Read FULL Seminar Here
Tax-Free Income Seminar
Bond Fund Seminar
RSVP-Signup Form
MARKET RESEARCH
Featured Quarterly Newsletter
Featured Articles
Contrarian Notes Blog
home
about us
Investment Approach
Client Service Approach
Market Analysis Summary
Mission Statement
Value Proposition
Team Biographies
Firm ADV PDFs
Form CRS
Firm Brochure-Part 2A of Form ADV
Brochure Supplement Amit Stavinsky
Brochure Supplement Frank Parks
Brochure Supplement Dominick Savo
Brochure Supplement Richard Mason
Brochure Supplement Joe Estes
Brochure Supplement Jonathan Ezra
Statement Of Financial Strength
Job Opportunities
Tamar Advisors
Own Your Practice
Letter to Clients
member log-in
contact us
PRODUCTS
Fixed Income Portfolio (FIP)
FIP Program
Services, Fees and Compensation
Client Information
Client Contact with Portfolio Manager(s)
Sample Portfolio
Back Dated Performance Reports
Quarterly Performance Reports
Total Asset Market (TAM)
TAM sm Program
Services, Fees and Compensation
Client Information
Client Contact with Portfolio Manager(s)
Sample Portfolio
Back Dated Performance Reports
Quarterly Performance Reports
Total Asset Fund (TAF)
TAF sm Program
Services, Fees and Compensation
Client Information
Client Contact with Portfolio Manager(s)
Sample Portfolio
Back Dated Performance Reports
Quarterly Performance Reports
Market Value Securities (MVS)
MVS Program
Services, Fees and Compensation
Client Information
Client Contact with Portfolio Manager(s)
Sample Portfolio
Back Dated Performance Reports
Quarterly Performance Reports
Total Asset Value (TAV)
TAV Program
Services, Fees and Compensation
Client Information
Client Contact with Portfolio Manager(s)
Sample Portfolio
Back Dated Performance Reports
Quarterly Performance Reports
Municipal Bonds
Taxable Bonds
Par, Premium, and Discount Bonds
Rating and Analyzing Bonds
Refunding & Pre-refunding
Bond Yields
Yield Curve
Secured Bonds
Mortgage Bonds
Unsecured Bonds
Debentures
Subordinated Debentures
Zero-Coupon Bonds
Convertible Bonds
High Yield Dividend Stocks
Independent Money Managers
Fees & Compensation
Corporate Cash Management
Fees & Compensation
Estate Planning
Financial Planning
Client Service Approach
Client's Responsibilities
Fees
Implementation
Legal Services
Termination
Professional Alliance Network
Client Service Approach
Client's Responsibilities
Fees
Implementation
Legal Services
Termination
MUNICIPAL BONDS
Municipal Bond Presentation
About Us
The Management
Global Asset Allocation Products
FIP Program
Classifying Municipal Bonds
Revenue Bonds
Credit Factors Affecting General Obligation Bonds
Credit Factors Affecting the Quality of Local Municipal Bonds
Analyzing the Credit Quality of General Obligation Bonds
Analyzing the Credit Quality of Revenue Municipal Bonds
What We Normally Buy
What We Normally Don’t Buy
Municipal Bonds – Unique Asset Class
Default Rates
Yield Difference
Turnkey Operation Platform
Advantages of Our Bid Wanted System
Advantages of Our Clearing System
Preferred Custodian Settlement
Advantages of Same-Day Allocation
TSL’s Turnkey Operation Platform
Classifying Municipal Bonds
Revenue Municipal Bonds
Types of Revenue Municipal Bonds
Industrial Development Revenue Bonds
Lease-back Bonds
Special Tax Bonds
NHA/PHA Bonds
Moral Obligation Bonds
Municipal Notes
TANs/RANs
BANs
CLNs/GANs
Variable Rate Bonds/Notes
Build America Bonds
Double-Barreled Bonds
Bond Index Components
Open-end-Closed-end-Indenture
Sinking Fund
Bond Contracts
Bond Indenture
Official Statement
Bond Issuance Process
Analyzing GO Bonds
Analyzing Revenue Bonds
Debt Ratios
General Price Analysis of Municipal Bonds
Liquidity
Interest Rate Risk
Credit Risk
Coupon Risk
Maturity Risk
Municipal Bond Insurance
Municipal Bonds Unique Asset Class
Default Rates
What We Buy Currently
What We Normally Don’t Buy
Turnkey Operation Platform
Advantages of Our Bid Wanted System
Advantages of Our Clearing System
Preferred Custodian Settlement
Advantages of Same Day Allocation
Traditional Broker/Dealer Execution Flow
TSL's Turnkey Operation Platform
INDEX FUNDS
Total Asset Fund (TAF)
TAF® Program
Services, Fees and Compensation
Client Information
Client Contact with Portfolio Manager(s)
Additional Information
Sample Portfolio
Back Dated Performance Reports
Quarterly Performance Reports
EVENTS
FIP
Event Schedule
TAM
Event Schedule
Total Asset Market (TAM sm) Presentation
TAF
Event Schedule
Total Asset Fund (TAF sm) Presentation
MVS
Event Schedule
Market Value Securities (MVS sm) Presentation
Featured Event
Calendar of Events
Events History
Investing During Uncertain Times
Read FULL Seminar Here
Tax-Free Income Seminar
Bond Fund Seminar
RSVP-Signup Form
MARKET RESEARCH
Featured Quarterly Newsletter
Featured Articles
Contrarian Notes Blog
Recent Quotes
View Full List
My Watchlist
Create Watchlist
Indicators
DJI
Nasdaq Composite
SPX
Gold
Crude Oil
Markets
Stocks
ETFs
Tools
Markets:
Overview
News
Currencies
International
Treasuries
Goldman Sachs Group
(NY:
GS
)
1,076.91
-17.53 (-1.60%)
Official Closing Price
Updated: 7:00 PM EDT, Jun 24, 2026
Add to My Watchlist
Quote
Overview
Detailed Quote
Charting
Historical Prices
News
Press Releases
Research
Quarterly Reports
Insider Filings
Other Filings
Price and Volume
Detailed Quote
Volume
1,933,083
Open
1,090.00
Bid (Size)
1,078.03 (40)
Ask (Size)
1,082.00 (40)
Prev. Close
1,094.44
Today's Range
1,068.51 - 1,090.10
52wk Range
653.24 - 1,125.00
Shares Outstanding
343,446,784
Dividend Yield
1.67%
Intraday
1 Week
1 Month
3 Month
1 Year
3 Year
5 Year
Top News
More News
Bloomin' Brands and Portillo's Shares Are Soaring, What You Need To Know
June 24, 2026
What Happened? A number of stocks jumped in the afternoon session after WTI crude fell below $70 per barrel, easing pressure on consumer wallets. Wendy's sur...
Via
StockStory
Topics
Economy
El Pollo Loco and Wingstop Stocks Trade Up, What You Need To Know
June 24, 2026
What Happened? A number of stocks jumped in the afternoon session after WTI crude fell below $70 per barrel, easing pressure on consumer wallets. Wendy's sur...
Via
StockStory
Topics
Economy
Performance
YTD
+17.8%
+17.8%
1 Month
+8.3%
+8.3%
3 Month
+27.9%
+27.9%
6 Month
+18.2%
+18.2%
1 Year
+62.6%
+62.6%
More News
Read More
Why Are Krispy Kreme (DNUT) Shares Soaring Today
June 24, 2026
Via
StockStory
Topics
Economy
Chewy Stock Is Moving Higher Today: What's Going On?
↗
June 24, 2026
Via
Benzinga
Wednesday's session: top gainers and losers in the dow jones index
↗
June 24, 2026
Via
Chartmill
Discover which dow jones stocks are making waves on Wednesday.
↗
June 24, 2026
Via
Chartmill
Is It Too Late to Buy Bloom Energy Stock After Its 1,410% Gain?
↗
June 24, 2026
Via
The Motley Fool
Topics
Artificial Intelligence
WD-40 (WDFC) Shares Skyrocket, What You Need To Know
June 24, 2026
Via
StockStory
Topics
Economy
The S&P 500 Is Up 9% in 2026. Wall Street Says the Stock Market Will Do This Next.
↗
June 24, 2026
Via
The Motley Fool
Topics
Artificial Intelligence
Economy
Government
Small Businesses Adopt AI Faster Than They Integrate It, AWAIS LLC Says
June 23, 2026
Via
AB Newswire
Topics
Artificial Intelligence
Is the "rate hike nightmare" really coming? Goldman Sachs Head of Investment: July is more likely!
↗
June 23, 2026
Via
Talk Markets
Topics
Economy
This Underrated Artificial Intelligence (AI) Stock Has Jumped 231% in 2026. Buy It Hand Over Fist Before It Becomes a Trillion-Dollar Company
↗
June 23, 2026
Via
The Motley Fool
Topics
Artificial Intelligence
Why Is Edgewell Personal Care (EPC) Stock Soaring Today
June 23, 2026
Via
StockStory
Topics
Economy
Uncover the latest developments among dow jones stocks in today's session.
↗
June 23, 2026
Via
Chartmill
Exploring the top movers within the dow jones index during today's session.
↗
June 23, 2026
Via
Chartmill
This Nvidia-Backed Company Just Entered the $154 Billion AI Photonics Market. Does This Make the $13 Stock a No-Brainer Buy?
↗
June 23, 2026
Via
The Motley Fool
Topics
Artificial Intelligence
Goldman Sachs Has A New Warning For Oil Bulls: EV Adoption Is Accelerating Fast
↗
June 23, 2026
Via
Benzinga
Gold's New Role Outweighs Its Technical Bear Market
↗
June 23, 2026
Via
Benzinga
Global Retail Banking Market Size, Share and Forecast, 2035
↗
June 23, 2026
Via
Talk Markets
Stock Market Today, June 22: Alphabet Slips on Key Departure and Defensive Blue Chips Gain
↗
June 22, 2026
Via
The Motley Fool
Topics
Artificial Intelligence
Bonds
Economy
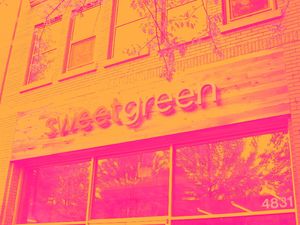
Why Sweetgreen (SG) Stock Is Nosediving
June 22, 2026
Via
StockStory
Topics
Economy
Wendy's and Jack in the Box Stocks Trade Down, What You Need To Know
June 22, 2026
Via
StockStory
Topics
Economy
Marvell Technology Has Soared 247% in 2026. Here's How Much Upside It Can Deliver Over the Next 3 Years
↗
June 22, 2026
Via
The Motley Fool
Topics
Artificial Intelligence
Stocks
The $725 Billion AI Capex Cycle Has 3 Bottlenecks: Power, Memory, and Optical Bandwidth. 3 Stocks Poised to Win Big.
↗
June 22, 2026
Via
The Motley Fool
Topics
Artificial Intelligence
Energy
A Blood Test That Screens for 50+ Cancers Just Moved Closer to Real-World Use. Here's What It Means for Grail Investors.
↗
June 21, 2026
Via
The Motley Fool
Frequently Asked Questions
Is Goldman Sachs Group publicly traded?
Yes, Goldman Sachs Group is publicly traded.
What exchange does Goldman Sachs Group trade on?
Goldman Sachs Group trades on the New York Stock Exchange
What is the ticker symbol for Goldman Sachs Group?
The ticker symbol for Goldman Sachs Group is GS on the New York Stock Exchange
What is the current price of Goldman Sachs Group?
The current price of Goldman Sachs Group is 1,076.91
When was Goldman Sachs Group last traded?
The last trade of Goldman Sachs Group was at 06/24/26 07:00 PM ET
What is the market capitalization of Goldman Sachs Group?
The market capitalization of Goldman Sachs Group is 369.86B
How many shares of Goldman Sachs Group are outstanding?
Goldman Sachs Group has 370B shares outstanding.
Stock Quote API & Stock News API supplied by
www.cloudquote.io
Quotes delayed at least 20 minutes.
By accessing this page, you agree to the
Privacy Policy
and
Terms Of Service
.
© 2025 FinancialContent. All rights reserved.